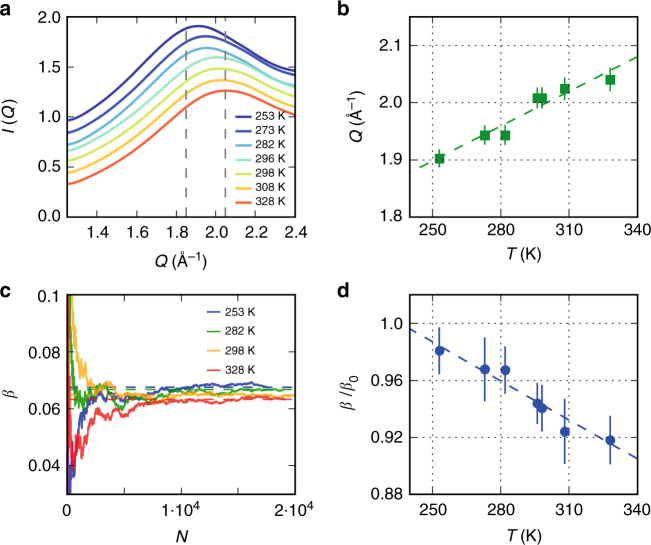
Fig. 4.
Temperature dependence. a Temperature dependence of the angularly integrated scattering intensity I(Q) as a function of momentum transfer Q. The dashed lines indicate the Q-range over which the speckle contrast was investigated. b Q value of the maximum of I(Q), where the dashed line highlights the shift of the peak to lower Q upon cooling. The errorbars is the standard error. c Cumulative average of the speckle contrast β over number of X-ray laser shots N for different temperatures as indicated in the figure. The dashed lines indicate the total average. d Corresponding average values of β/β0, with error bars corresponding to the standard error. The dashed line highlights the increase of the speckle contrast upon cooling, which is an indication of gradual slowing down of the molecular motion within the exposure time δt = 75 fs

