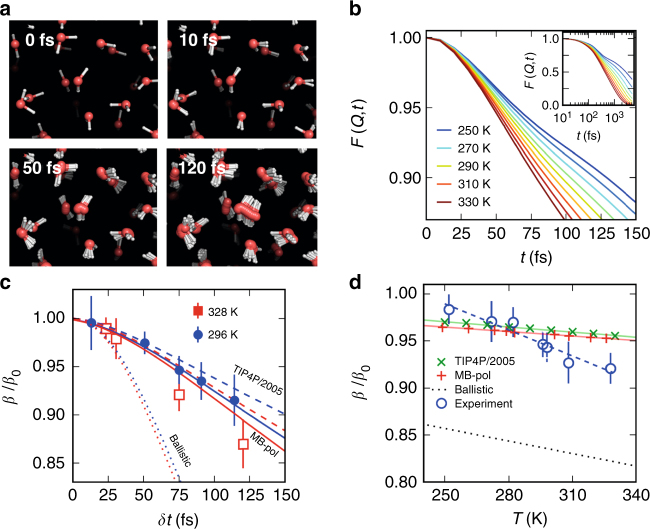
Fig. 5.
Molecular dynamics simulations and comparison to experiment. a Snapshots from the simulations for different exposure times comparable to the experiment. b The intermediate scattering function F(Q,t) obtained from TIP4P/2005 at different temperatures. The inset depicts F(Q,t) over longer times in logarithmic scale. c Comparison of the normalized speckle contrast between theory and experiment. The symbols are the experimental data at two different temperatures (circles 296 K, squares 328 K). The lines are simulated values using TIP4P/2005 (dashed) and MB-pol (solid), while the dotted lines correspond to the purely ballistic case at temperatures 300 K (blue) and 330 K (red). d Comparison of the speckle contrast as a function of temperature as estimated from the experiment (circles) with simulations (crosses MB-pol, x’s TIP4P/2005) and the purely ballistic case (dotted line) at δt = 75 fs. The lines depict linear fits to highlight the difference in slope between experiment and simulations. The errorbars in c and d correspond to the standard error

