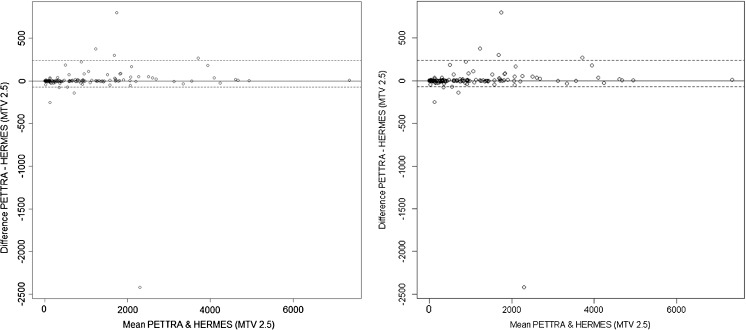
Fig. 1.
Bland-Altman plot of MTV2.5 measured using PETTRA (in-house) software and Hermes (commercial) software. The horizontal axis represents the mean of the two MTV methods and the vertical axis, the difference between them. The solid line shows the median difference (close to zero) and the dashed lines show the 95% limits of agreement (LoA). The median is very close to zero, indicating no systematic difference between the methods, and the range of LoA is relatively small compared to the scale of the MTV values, indicating a good numerical agreement in the methods among the majority of patients

