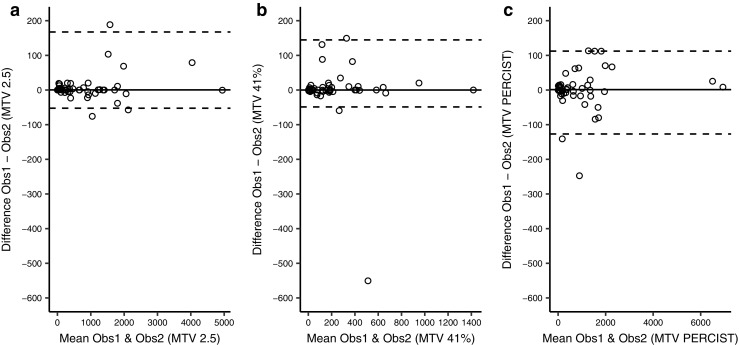
Fig. 3.

Bland-Altman plots (see Fig. 1 caption for description) comparing MTV measured by the different methods by two different observers. The median difference (solid lines) is close to zero for all three methods, indicating no systematic bias. The LoAs (dashed lines) are close, indicating good agreement
