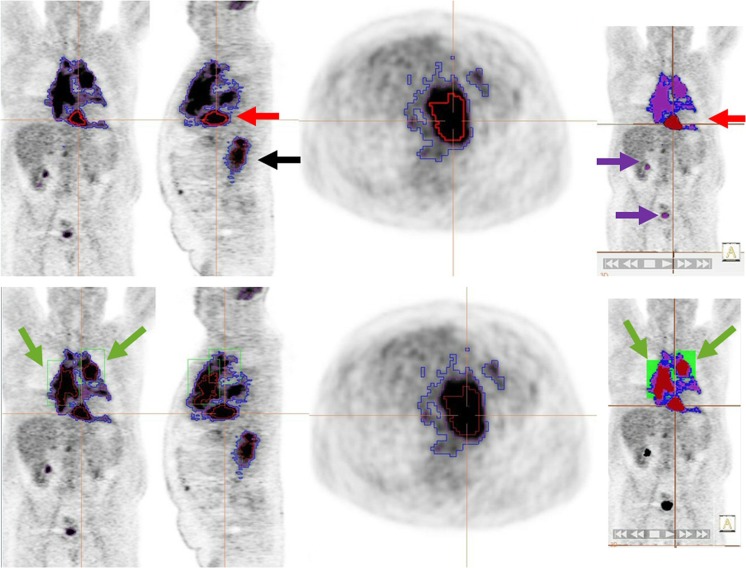
Fig. 6.
An example of a case outlined using the 2.5 method (blue), the 41% method (red) and the PERCIST method (purple) with representative coronal, sagittal, axial and 3D images. The top panel shows the initial ‘automatic’ volumes. All methods result in similar volumes for disease below the diaphragm (black arrow, sagittal view). However, for disease above the diaphragm, the MTV is grossly underestimated using the 41% method and separate bounding boxes of differing sizes have to be drawn (green boxes in the bottom panel) to delineate 2 additional volumes, increasing the time and complexity of MTV selection. The PERCIST method detects physiological uptake in the brain and urinary tract (purple arrows) which must be edited out by the observer

