Fig. 3.

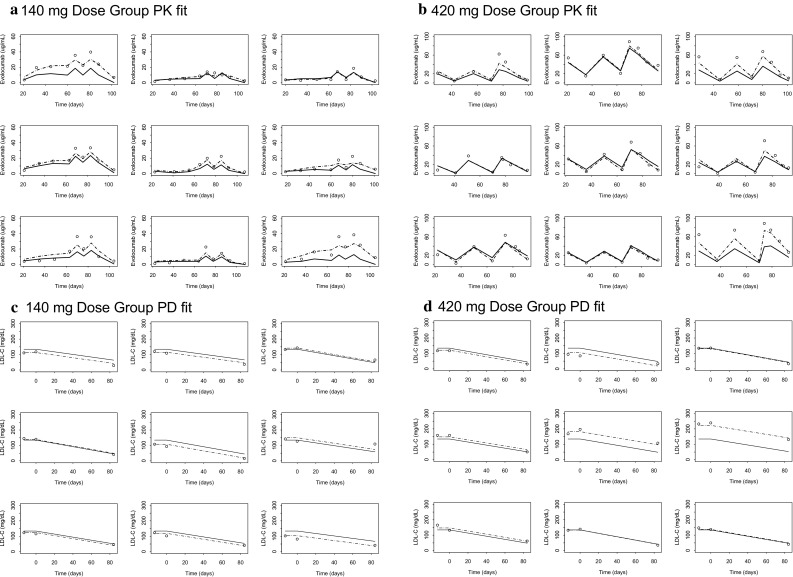
PK and PD individual model fits for representative patients. Points: observations; solid line: population prediction (PRED); dashed line: individual prediction (IPRED)

PK and PD individual model fits for representative patients. Points: observations; solid line: population prediction (PRED); dashed line: individual prediction (IPRED)