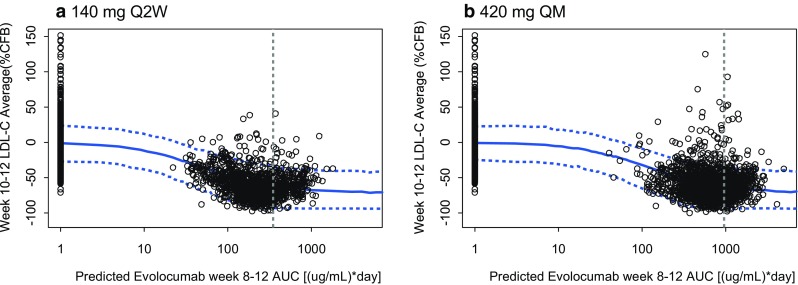
Fig. 6.

Observed data and 90% prediction interval for week 10 and 12 mean calculated LDL-C for phase 2 studies by weeks 8–12 evolocumab-predicted AUC. Prediction of the mean week 10 and 12 calculated LDL-C concentration, in percentage change from baseline, 50th (solid line) and 5th and 95th (dashed lines) percentiles. Simulations were performed for n = 2000 patients. Points: observed individual mean of weeks 10 and 12 LDL-C measurements. Vertical line: mean observed AUCwk8–12 in phase 2. %CFB percentage change from baseline; AMG 145 evolocumab; AUC area under the concentration–time curve; LDL-C low-density lipoprotein-cholesterol; Q2W once every 2 weeks; QM once monthly
