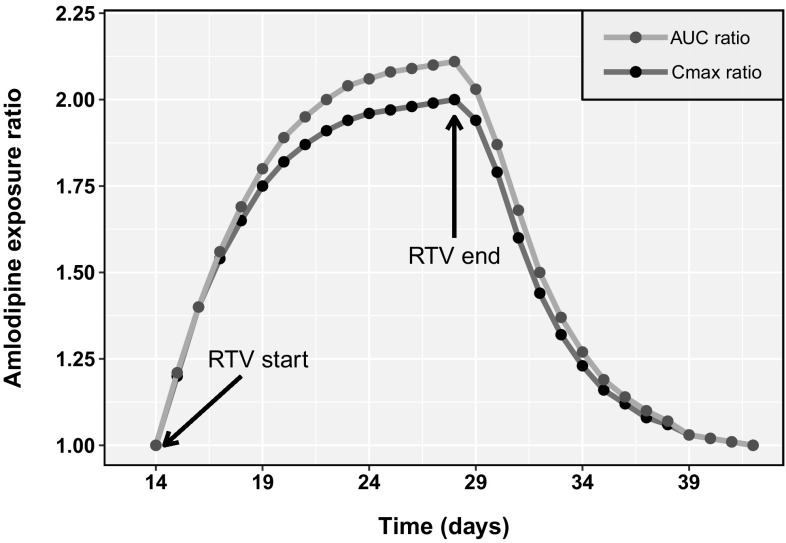
Fig. 3.
Model prediction of time-based changes in the drug–drug interaction (DDI) magnitude of amlodipine and ritonavir (RTV) over multiple days after amlodipine [2.5 mg once daily (QD)] + RTV (100 mg QD) co-dosing for 14 days (Day 15–Day 28), followed by continuation of amlodipine (2.5 mg QD) alone. This was preceded by amlodipine (2.5 mg QD) dosing for 14 days. The area under the plasma-concentration time curve from time 0 to 24 h (AUC24) ratio (orange line) and maximum plasma concentration (Cmax) ratio (blue line) of amlodipine were estimated with respect to steady-state (Day 14) values as reference. (RTV start indicates starting of co-administration of RTV; RTV stop indicates RTV stoppage) (Color figure online)

