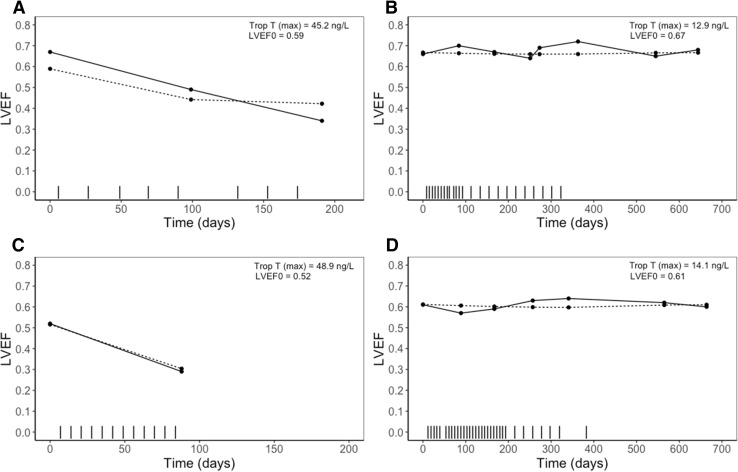
Fig. 4.
Panels of individual plots for observed (solid line) and individual predicted (dotted line) left ventricular ejection fractions (LVEFs) over time for four different patients. Vertical dashes represent the trastuzumab administrations. a Patient with maximum troponin T values in the higher range, relatively high baseline and a significant decline in LVEF value. b Patient with lower maximum concentration of troponin T, normal baseline and no significant decline in LVEF. c Patient with maximum troponin T values in the higher range, relatively low LVEF baseline and a significant decline in LVEF. d Patient with maximum troponin T values in the lower range, relatively high LVEF baseline and no significant decline in LVEF

