Figure 6.
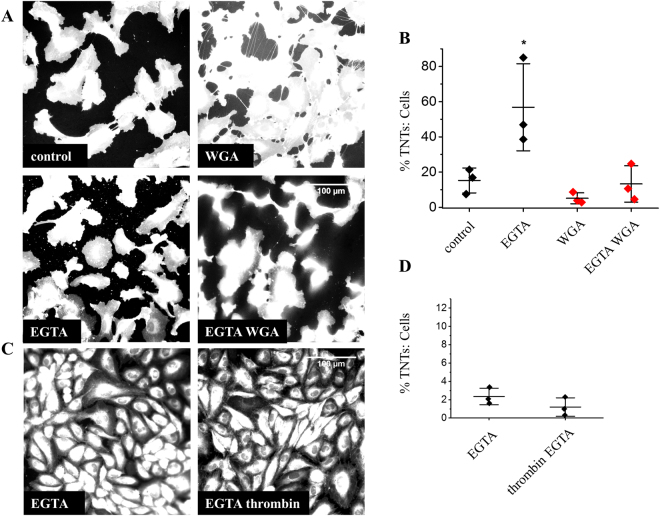
WGA and thrombin TNT formation is Ca2+-dependent. (A) Example images of cell mask stained HUVECs in control medium or medium with 5 mM EGTA +/− 10 μg/ml WGA showing a significant inhibition of WGA-induced TNTs in Ca2+ chelated medium. (B) Mean data (n/N = 3/30 for each group) of images in (A,C). Example images of cell mask stained HUVECs in control medium containing 5 mM EGTA or medium with 5 mM EGTA + 1 U/ml thrombin. Thrombin did not evoke TNT formation in the presence of Ca2+ chelated medium (significantly different to the thrombin effect at 1 hr. in Fig. 4D). (D) Mean data (n/N = 3/15 for each group) of images in (C) and Fig. 4(B). Data are represented as mean ± SD. *P < 0.05. Scale bars are 100 μm.

