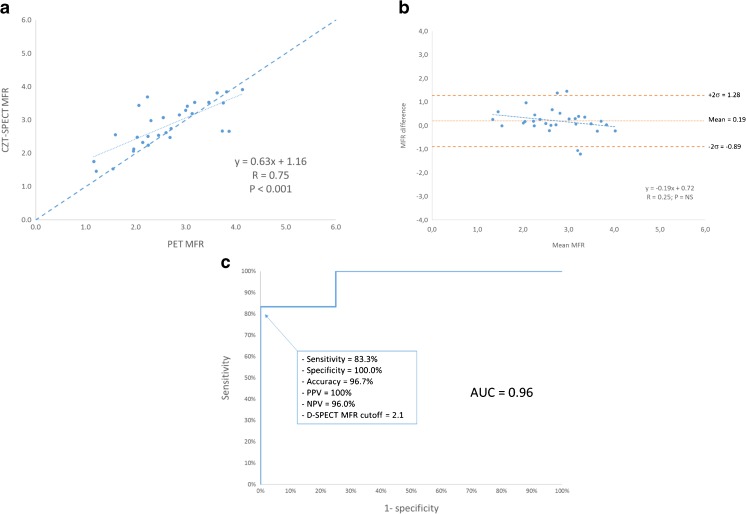
Fig. 4.
a. Correlation between PET and CZT-SPECT for global MFR in 30 patients. MFR estimates by CZT-SPECT plotted against MFR measured by PET. The dashed line is the fit obtained from total least square regression. b. Bland-Altman plots between PET and CZT-SPECT for global MFR in 30 patients. c. ROC curve showing the sensitivity and specificity of CZT-SPECT for the diagnostic of abnormal stress PET MFR (< 2)

