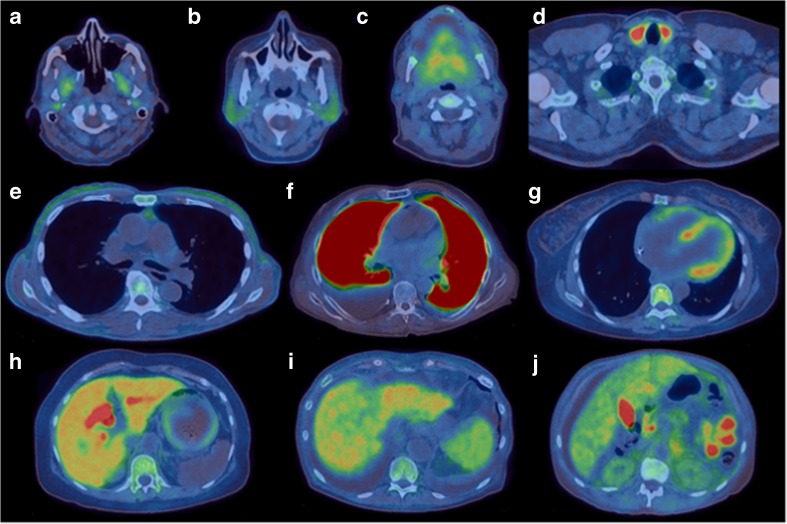
Fig. 2.
Transaxial 18F-florbetapir fused PET/CT images showing representative areas of tracer uptake: a pterygoids (patient 3), b parotids (patient 2), c tongue (patient 17), d thyroid (patient 14), e subcutaneous and pericardial fat (patient 8), f lungs (patient 7), g heart and bone marrow (patient 2), h liver, bile ducts and stomach wall (patient 2), I liver and spleen (patient 1), j liver, gallbladder, small bowel and kidneys (patient 13)

