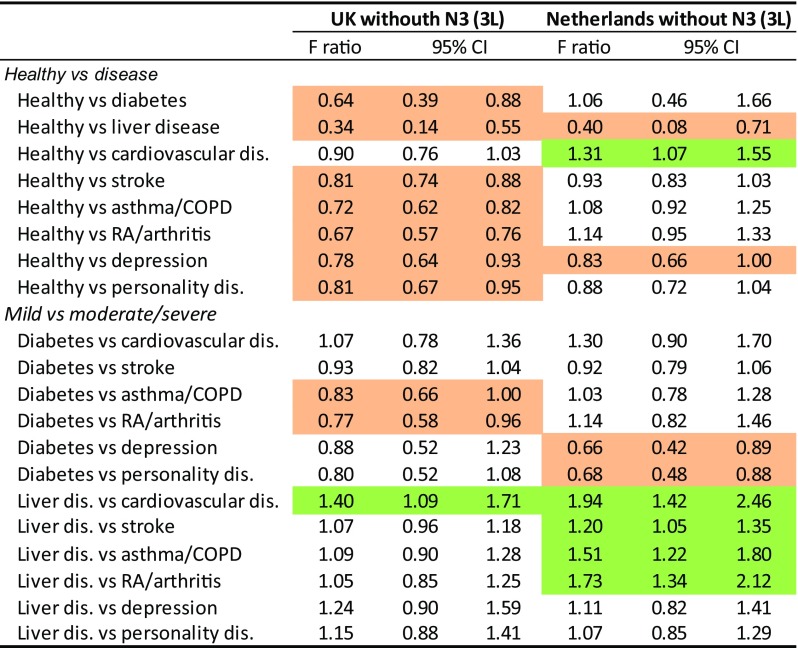
Fig. 8.
Sensitivity analysis main effects without N3 for UK and The Netherlands: observed relative efficiency of 5L over 3L using the F statistic ratio. Green cells indicate a significant F ratio showing better discriminatory power for 5L, orange cells for 3L (95% CI, 3000 bootstrap samples). 3L EQ-5D-3L, 5L EQ-5D-5L, CI confidence interval, COPD chronic obstructive pulmonary disease, dis. disease/disorder, N3 any level 3, RA rheumatoid arthritis

