Fig. 5.
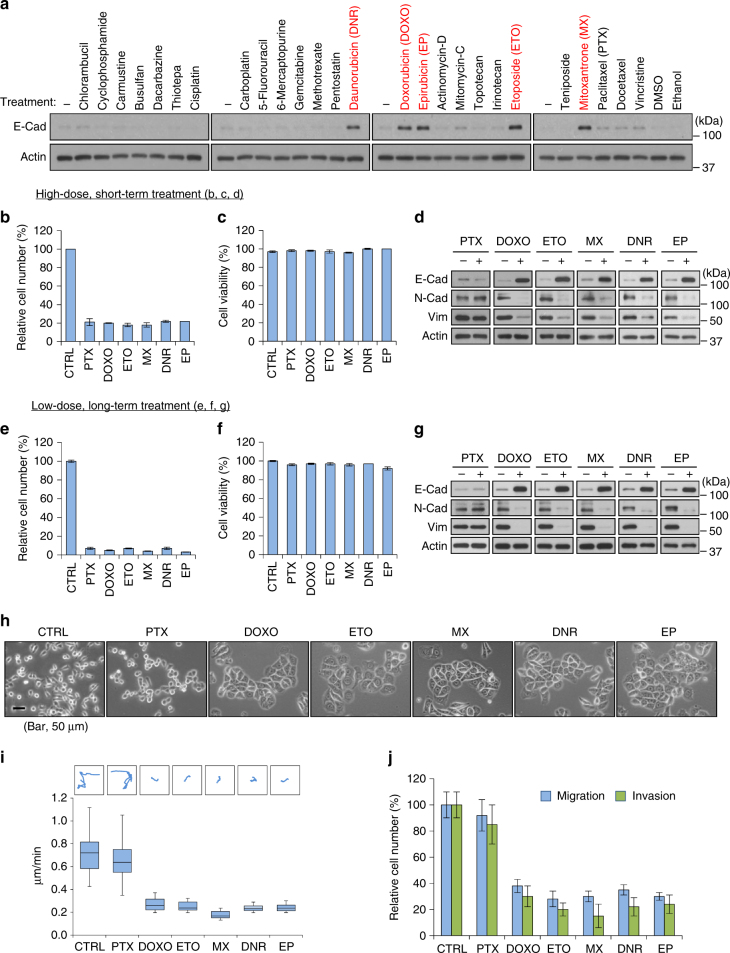
DNA topoisomerase II (TOP2) poisons induce mesenchymal–epithelial transition (MET). a Western blot analysis of epithelial marker E-cadherin (E-Cad) induction in mesenchymal-like 4T1 cells treated with indicated agents for 24 h (please check Supplementary Table 1 for compound concentrations). Compounds that significantly induce E-cadherin are labeled in red. b Relative cell number after treatment of indicated agents at a high-dose, short-term schedule. CTRL control, PTX paclitaxel (1 μM, 24 h), DOXO doxorubicin (2 μM, 24 h), ETO etoposide (10 μM, 24 h), MX mitoxantrone (2 μM, 24 h), DNR daunorubicin (1 μM, 24 h), EP epirubicin (1 μM, 24 h). c Cell viability of resting cells after treatment of indicated agents at a high-dose, short-term schedule. Cell viability was analyzed by trypan blue exclusion. d Western blot analysis of EMT markers (E-cadherin, N-cadherin, Vimentin) in resting cells after treatment of indicated agents at a high-dose, short-term schedule. e Relative cell number after treatment of indicated agents at a metronomic (low-dose, long-term) schedule. CTRL control, PTX paclitaxel (0.02 μM, 96 h), DOXO doxorubicin (0.05 μM, 96 h), ETO etoposide (0.2 μM, 96 h), MX mitoxantrone (0.05 μM, 96 h), DNR daunorubicin (0.02 μM, 96 h), EP epirubicin (0.02 μM, 96 h). f Cell viability of resting cells after treatment of indicated agents at a metronomic (low-dose, long-term) schedule. g Western blot analysis of EMT markers (E-cadherin, N-cadherin, Vimentin) in resting cells after treatment of indicated agents at a metronomic (low-dose, long-term) schedule. h Representative phase-contrast microscopy images of 4T1 cells treated with indicated agents. Scale bar, 50 μm. i Representative trajectories and quantification of motility speed of 4T1 cells treated with indicated agents. The box plots represent sample maximum (upper end of whisker), upper quartile (top of box), median (band in the box), lower quartile (bottom of box), and sample minimum (lower end of whisker). j Migration and invasion assays of 4T1 cells treated with indicated agents. All error bars represent s.d. (n = 3)

