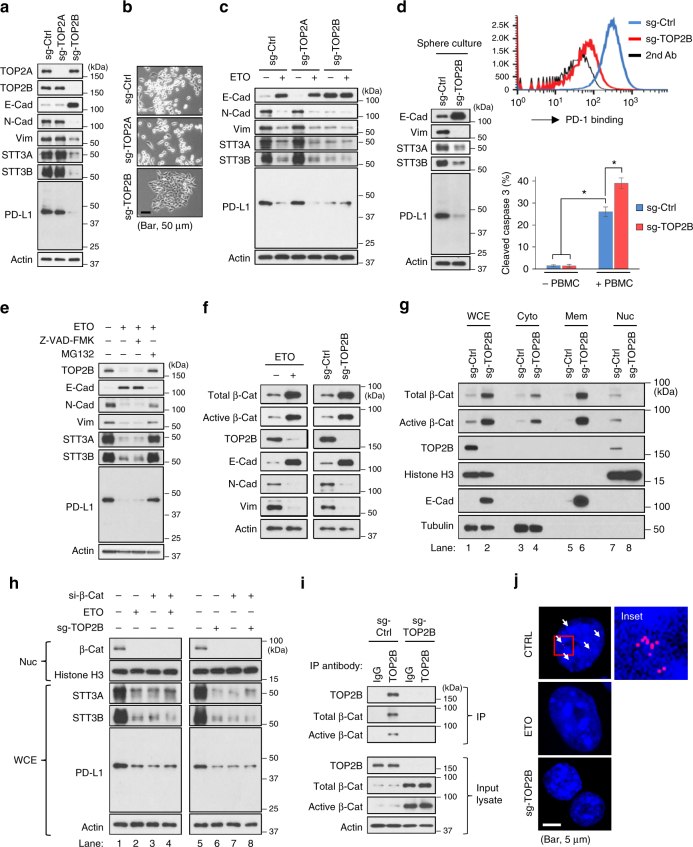
Fig. 8.
Etoposide inhibits the EMT/β-catenin/STT3/PD-L1 axis through TOP2B degradation-dependent nuclear β-catenin downregulation. a Effect of TOP2 isoforms knockdown on the expression of EMT markers, STT3 and PD-L1 in 4T1 cell. b Representative phase-contrast microscopy images of 4T1 cell treated with indicated sg-RNAs. Scale bar, 50 μm. c Influence of TOP2 isoforms knockdown on etoposide-induced MET and downregulation of STT3 and PD-L1. d Western blot analysis (left), PD-1 binding assay (upper right), and in vitro PBMC-mediated cancer cell killing assay (bottom right) of tumorspheres cultured from various sgRNA-treated 4T1 cells. e Effect of proteasome inhibitor (MG132) and caspase inhibitor (Z-VAD-FMK) on etoposide-induced TOP2B degradation, MET, and downregulation of STT3 and PD-L1. f Western blotting of whole-cell extracts analyzing the effect of etoposide and TOP2B knockdown on total and active (non-phospho) β-catenin (β-Cat). g Western blotting of whole-cell extracts (WCE), cytosolic (Cyto), membrane (Mem), or nuclear (Nuc) fractions from sgRNA-treated 4T1 cells analyzing the effect of TOP2B knockdown on β-catenin subcellular localizations. Histone H3, E-cadherin (E-Cad), and tubulin were used as makers of nuclear, membrane, and cytosolic fractions, respectively. h Efficacy of β-catenin knockdown (si-β-Cat) in desensitizing cells to etoposide- and sg-TOP2B- induced MET and downregulation of STT3 and PD-L1. Nuc nuclear fraction, WCE whole-cell extracts. i Co-immunoprecipitation assay showing interaction between TOP2B and β-catenin. j Duolink assay analyzing the interaction of TOP2B and active (non-phospho) β-catenin in the nucleus. Red dots (indicated by arrows) represented TOP2B-β-catenin interaction signals and nuclei were counterstained with DAPI (blue). The right column shows higher-magnification image of the area outlined in the left column. Scale bar, 5 μm. Error bars represent s.d. (n = 3). *P < 0.05, Student’s t-test. See also Supplementary Fig. 8

