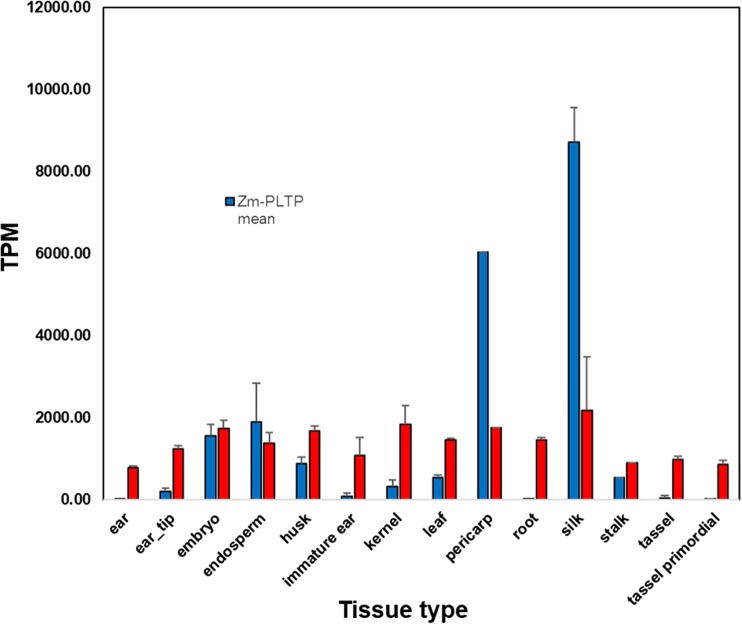
Figure 2.
Gene expression profile for Zm-PLTP and Zm-UBI. Values are the average gene expression across samples grouped by major tissue category (unit: parts per million sampled reads or the numerical equivalent transcripts per million). Black bars represent the 95% confidence interval around mean). All samples contained multiple bio-replicates except for pericarp and stalk

