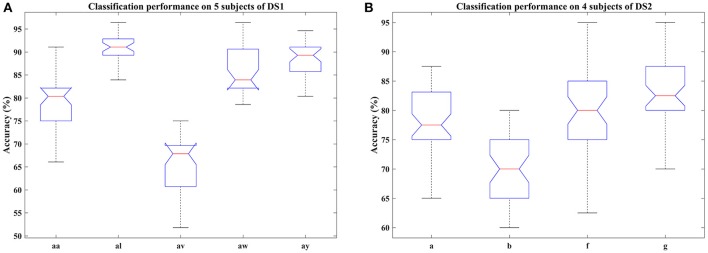
Figure 3.
Classification performance of COL on nine subjects: (A) aa, al, av, aw, and ay of DS1, (B) a, b, f, and g of DS2. Blue box indicates the range from 25 and 75% of the accuracy distribution, red line marks the median of the accuracy, notches in the box indicate the variability of the median between samples at the 5% significance level, extended whisker is the furthest observations in the range of 1.5 times the interquartile range away from the top or bottom of the box.

