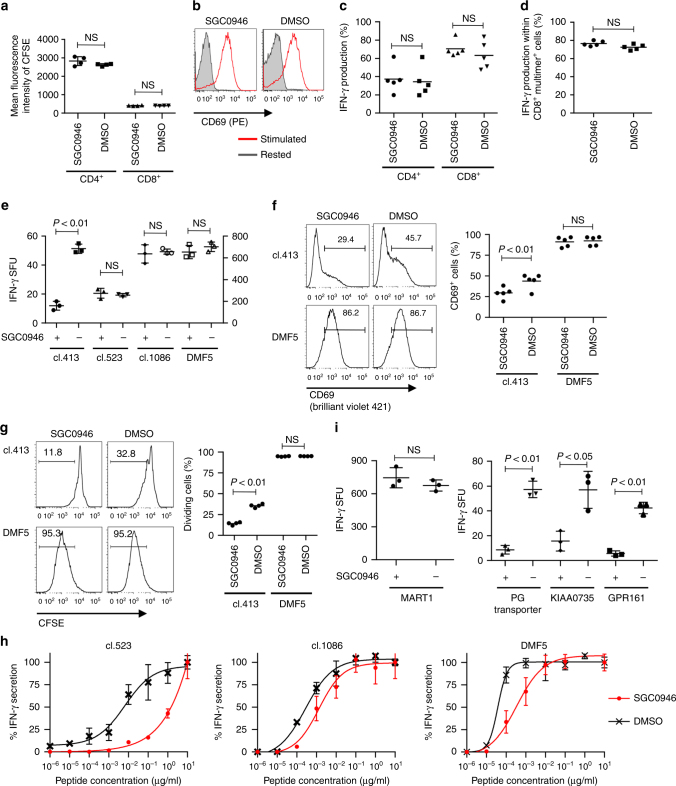
Fig. 2.
DOT1L selectively attenuates low-avidity T-cell responses. a, b CD3+ T cells treated with SGC0946 or DMSO were labeled with CFSE and restimulated with aAPC/mOKT3 (day 0). The mean fluorescence intensity of CFSE on day 4 (a) and representative CD69 expression on day 1 (b) are shown (n = 4 cultures, unpaired two-sided t-test for each T-cell population). c IFN-γ production by SGC0946- or DMSO-treated T cells upon restimulation with aAPC/mOKT3 was analyzed with flow cytometry (n = 5 different donor samples, paired two-sided t-test). d CD8+ T cells retrovirally transduced with HLA-A2/MART1 TCR (clone DMF5) were treated with SGC0946 or DMSO and analyzed for intracellular IFN-γ in the CD8+ A2/MART127–35 multimer+ T-cell population upon stimulation with aAPC/A2 loaded with 10 μg/ml heteroclitic A2/MART127–35 peptide (n = 5 different donor samples, paired two-sided t-test). e–h CD8+ T cells individually transduced with the indicated TCRα/β genes were treated with SGC0946 or DMSO for 1 week and stimulated with aAPC/A2 loaded with 10 μg/ml A2/MART1 peptide. The IFN-γ secretion was analyzed with ELISPOT assays (e, n = 3 cultures; unpaired two-sided t-test). The left y-axis is for TCR clone 413, and the right is for the other TCR clones. CD69 expression on day 1 (f, n = 5 different donor samples, paired two-sided t-test) and CFSE dilution on day 4 (g, n = 4 different donor samples, paired two-sided t-test) were analyzed within the TCR-transduced CD8+ T-cell population. The secretion of IFN-γ relative to the maximal response was analyzed by ELISPOT assays (h, n = 3 cultures for each). i A2/MART1 high-avidity T cells (clone 830) were treated with SGC0946 or DMSO and stimulated with aAPC/A2 pulsed with the indicated peptides (10 ng/ml). IFN-γ secretion was analyzed with ELISPOT assays (n = 3 cultures, unpaired two-sided t-test). NS, not significant. Horizontal lines represent the means ± s.d

