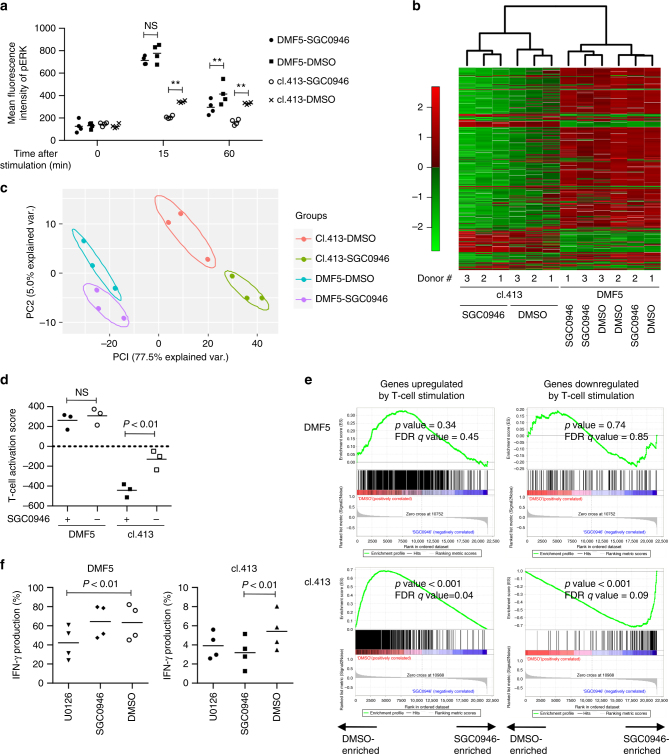
Fig. 5.
DOT1L inhibition selectively suppresses gene expression alterations induced by low-avidity T-cell stimulation. a CD8+ T cells with high avidity (DMF5) and low avidity (clone 413) for A2/MART1 were stimulated with aAPC/A2 loaded with 10 μg/ml heteroclitic A2/MART127–35 peptide with or without SGC0946 treatment. The mean fluorescence intensity of pERK within the CD8+ T-cell population at the indicated time points is shown (n = 4 different donor samples, paired two-sided t-test). b–e The DMF5- or clone 413 TCR-transduced CD8+ T cells were treated with SGC0946 or DMSO and stimulated for 24 h with aAPC/A2 loaded with 10 μg/ml heteroclitic A2/MART127–35 peptide. Gene expression profiles of the stimulated T cells were analyzed. Unsupervised hierarchical clustering (b) and principal component analysis (c) were performed on the genes with altered expression upon TCR stimulation retrieved from GSE13887 (false discovery rate <0.001 and >two-fold change in expression). d The T-cell activation score was calculated in each sample using the above gene set (n = 3 different donor samples for each group, repeated measures one-way ANOVA with Tukey’s multiple comparisons test). e Gene set enrichment analysis (GSEA) on expression profiles of the SGC0946-treated versus DMSO-treated T cells using the genes upregualted or downregualted upon TCR stimulation as gene sets. f CD3+ T cells transduced with the A2/MART1 TCR (clone 413 or DMF5) were pretreated with 2.5 μM U0126 or 0.5 μM SGC0946 and stimulated with aAPC/A2 loaded with 10 μg/ml heteroclitic A2/MART127–35 peptide. IFN-γ production normalized to transduction efficiency was analyzed with flow cytometry (n = 4 different donor samples, repeated measures one-way ANOVA with Tukey’s multiple comparisons test). **P < 0.01. NS, not significant. Horizontal lines indicate the mean values

