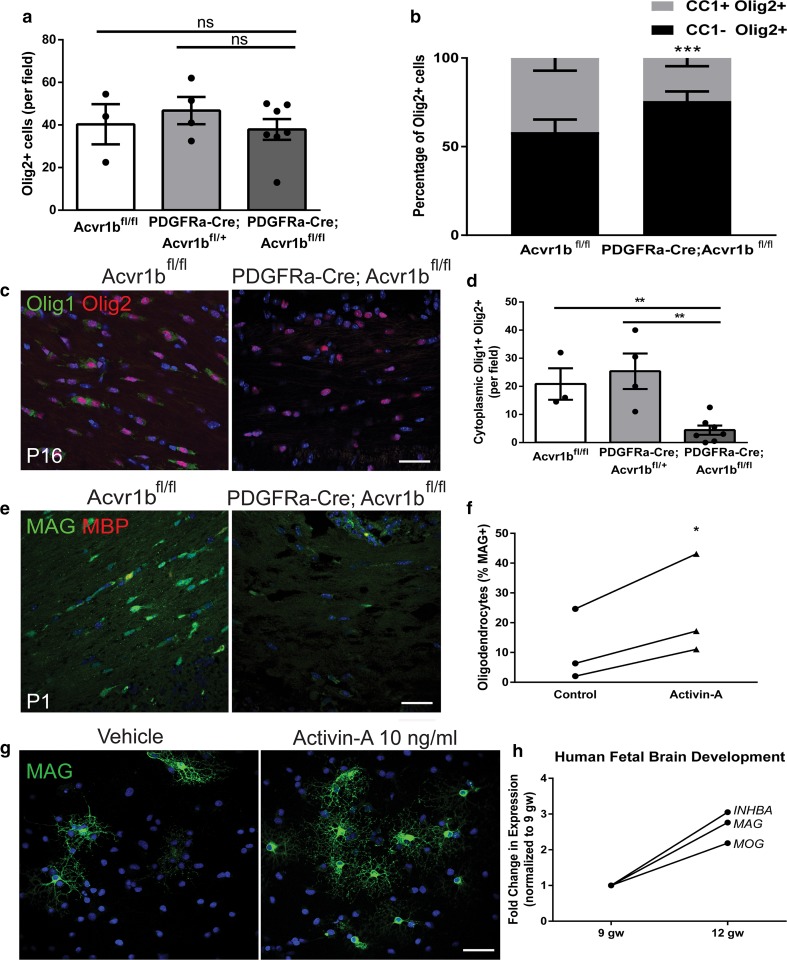
Fig. 2.
Activin receptor signaling regulates oligodendrocyte differentiation. a Mean number of oligodendrocyte lineage cells (Olig2+) per field ± s.e.m. in corpus callosum of P16 Acvr1bfl/fl (n = 3 mice), PDGFRa-Cre; Acvr1bfl/+ (n = 4 mice) and PDGFRa-Cre; Acvr1bfl/fl mice (n = 7 mice). b Mean proportion of oligodendrocyte lineage cells (Olig2+) which are mature oligodendrocytes (CC1+) versus immature cells (CC1−), per field ± s.e.m. in corpus callosum of P16 Acvr1bfl/fl (n = 4 mice) and PDGFRa-Cre; Acvr1bfl/fl mice (n = 7 mice). Multiple t tests with false discovery rate of 1%, ***P = 0.000026. c Images of differentiating oligodendrocytes (cytoplasmic Olig1+ and nuclear Olig2+) in corpus callosum of P16 Acvr1bfl/fl and PDGFRa-Cre; Acvr1bfl/fl mice. Scale bar 25 μm. d Mean number of cytoplasmic Olig1 and Olig2 double positive cells per field ± s.e.m. in corpus callosum of P16 Acvr1bfl/fl (n = 3 mice), PDGFRa-Cre; Acvr1bfl/+ (n = 4 mice) and PDGFRa-Cre; Acvr1bfl/fl mice (n = 7 mice). Two-tailed Student’s t test, **P = 0.0047, 0.0026, respectively. e Images of maturing oligodendrocytes (MAG+ MBP−) at P1 in corpus callosum of Acvr1bfl/fl and PDGFRa-Cre; Acvr1bfl/fl mice. Scale bar 25 μm. f Mean number of MAG+ cultured oligodendrocytes per field in vehicle control-treated or activin-A-treated conditions (10 ng ml−1) in vitro. n = 3 biological replicates. Two-tailed paired Student’s t test, *P = 0.0484. g Images of cultured OPCs treated with vehicle or 10 ng ml−1 activin-A and immunostained for MAG (green), counterstained with Hoechst (blue). Scale bar 25 μm. h Data-mining of microarray of human fetal brain at 9 and 12 gestational weeks (gw) represented as fold change in expression (normalized to 9 gw), showing paralleled expression changes between activin-A (INHBA) and oligodendrocyte differentiation-associated genes (MAG, MOG) in development

