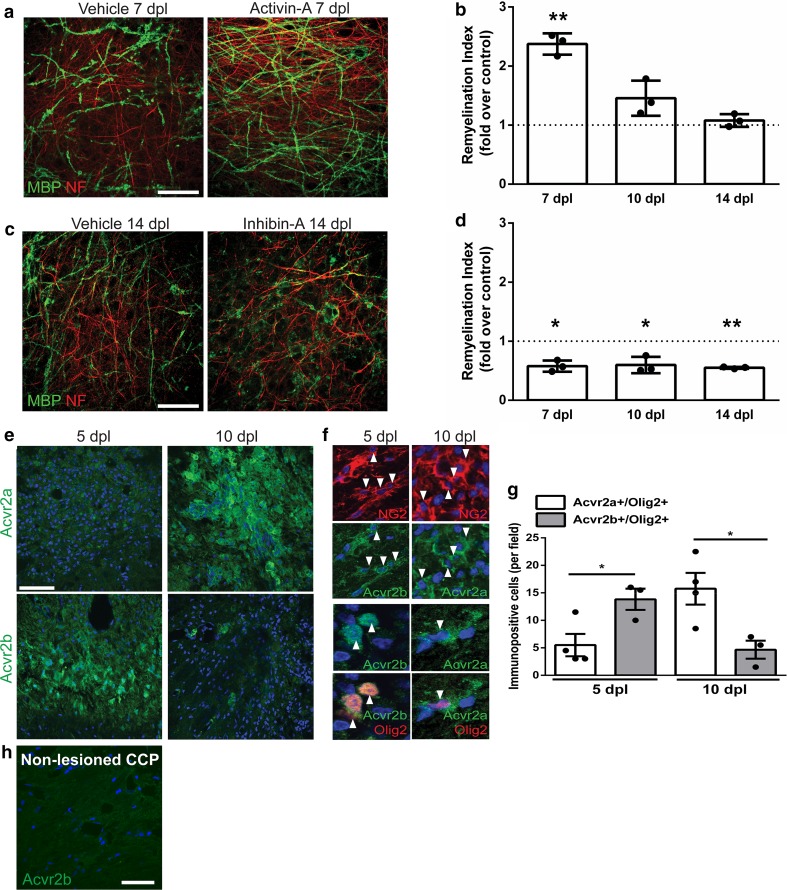
Fig. 5.
Activin receptor signaling regulates remyelination. a Representative images of organotypic cerebellar slice cultures at 7 days post lysolecithin-induced demyelination, treated with vehicle control or activin receptor agonist activin-A during remyelination, immunostained against myelin basic protein (MBP; green), and axonal neurofilament-H (NF; red). Scale bar 50 μm. b Mean remyelination index ± s.e.m. in activin-A-treated explants at 7, 10, and 14 days post lysolecithin (dpl) normalized to vehicle control from the respective time point. n = 3 animals, one-sample t test compared to theoretical mean of 1 (control), **P = 0.0057. c Representative images of slice cultures at 14 dpl treated with vehicle control or an inhibitor of activin receptor signaling inhibin-A during remyelination, immunostained against myelin basic protein (MBP; green) and axonal neurofilament-H (NF; red). Scale bar 50 μm. d Mean remyelination index ± s.e.m. in inhibin-A-treated explants at 7, 10, and 14 dpl normalized to vehicle control from the respective time point. n = 3 animals, one-sample t test compared to theoretical mean of 1 (control), *P = 0.0165, *0.0374, **0.0004, respectively. e Acvr2a and Acvr2b expression (green) in demyelinated caudal cerebellar peduncles (CCP) at 5 days post-lesion (dpl; prior to remyelination) and 10 dpl (onset of remyelination), counterstained with Hoechst (blue). Scale bar 25 μm. f Colocalization of Acvr2b or Acvr2a (green) with NG2 (top 2 rows; red; arrowheads) or Olig2 (bottom 2 rows; red; arrowheads) at 5 and 10 dpl in CCP, counterstained with Hoechst (blue). g Mean number of cells double positive for Olig2 and Acvr2a or Acvr2b per field ± s.e.m. at 5 and 10 dpl. n = 3 = 4 animals per group. Two-tailed Student’s t test, P = 0.0345 (5 dpl), 0.0298 (10 dpl). h Non-lesioned CCP shows no staining of Acvr2b (green). Scale bar 10 μm

