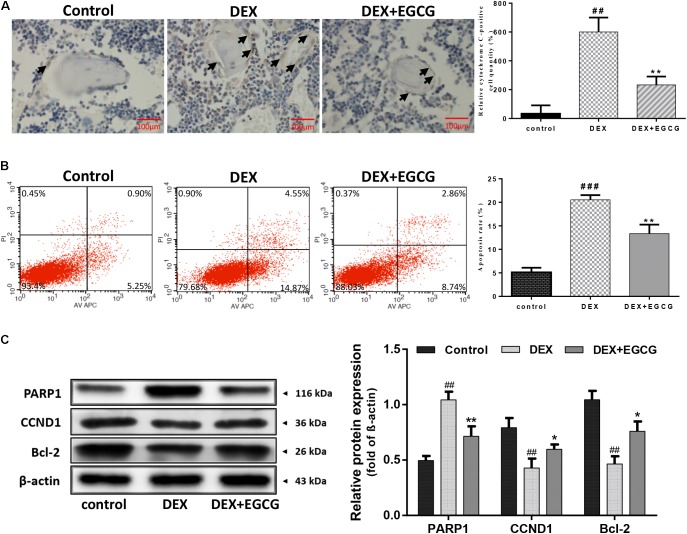
FIGURE 2.
Protective effect of EGCG against DEX-induced apoptosis in GIO. (A) Cell apoptosis was measured by immunohistochemistry (arrow indicates cytochrome C positive cells) and was statistically evaluated. (B) Flow cytometric analysis was used to measure apoptotic rate, and the level of apoptotic rate was statistically evaluated, as shown in the column. (C) Expression of apoptosis-related protein was measured by Western blot, and quantitated levels of protein were statistically evaluated, as shown in the column. The data were expressed as the mean ± SD. ###P < 0.001, ##P < 0.01, #P < 0.05 vs. control and ∗∗P < 0.01, ∗P < 0.05 vs. DEX.

