Figure 1.
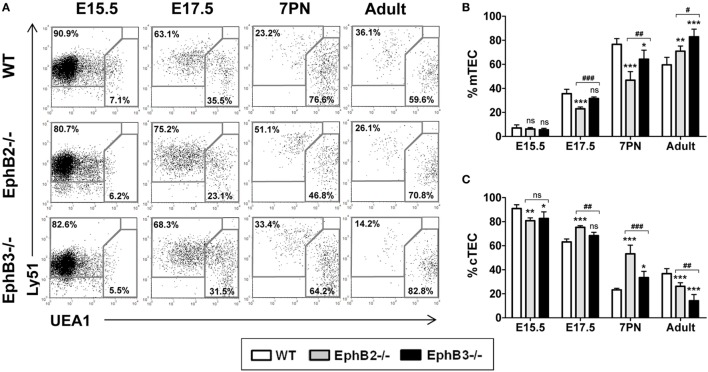
Thymic epithelial cell (TEC) subsets defined according to Ly51 and UEA1 expression in fetal (E15.5, E17.5), postnatal (7PN), and adult wild type (WT) and EphB-deficient mice. (A) Dot plots representative of at least five analyses, gating in total WT and mutant EpCAM+CD45− epithelial cells, show the maturation of both medullary TECs (mTECs) (Ly51−UEA1+) and cTECs (Ly51+UEA1−). Numerical values indicate the frequency of each cell population. (B,C) Proportion of mTEC (B) and cTEC (C) subsets at different stages of thymus development. In both figures, the significance of the Student’s t-test probability between WT and mutant values is indicated: *p ≤ 0.05; **p ≤ 0.01; ***p ≤ 0.005; or when mutant values are compared between them: #p ≤ 0.05; ##p ≤ 0.01; ###p ≤ 0.005; ns, non-significant.

