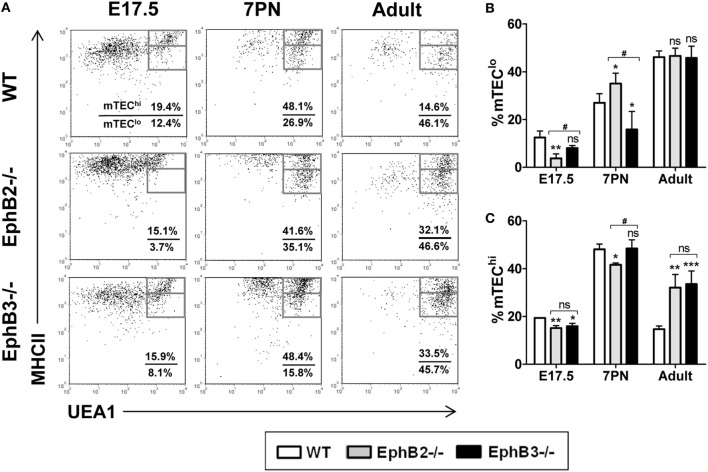
Figure 2.
Medullary TECs (mTEC) subsets defined by the expression of UEA1/MHCII cell markers in E17.5, 7PN, and adult thymi in both wild type (WT) and EphB-deficient mice. (A) Dot plots show mTEClo (MHCIImedUEA1+) and mTEChi (MHCIIhiUEA1+) cell subpopulations according to MHCII and UEA1 expression, gated in total EpCAM+CD45− cells. Numerical values show the frequency of each population. (B,C) Figures show the proportions of mTEClo (B) and mTEChi cells (C). The significance of the Student’s t-test probability is indicated: *p ≤ 0.05; **p ≤ 0.01; ***p ≤ 0.005; and #p ≤ 0.05 between mutants; ns, non-significant.

