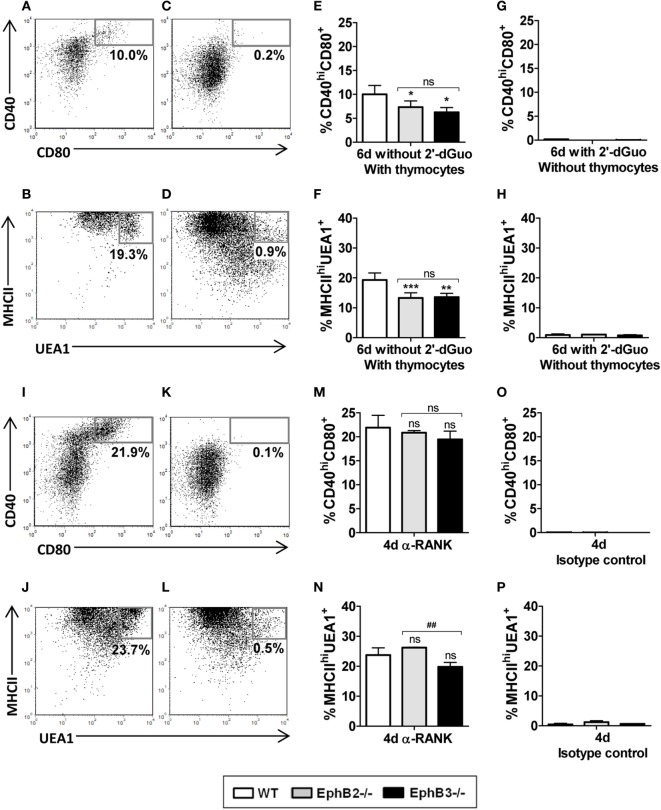
Figure 8.
Analysis of the proportions of CD40hiCD80+ and MHCIIhiUEA1+ medullary TECs (mTECs) in wild type (WT) and mutant fetal thymus organ cultures (FTOCs) cultured in presence or absence of thymocytes and after anti-RANK stimulation. (A,B) Dot plots, gated in total EpCAM+CD45−, show the presence of CD40hiCD80+ (A) and MHCIIhiUEA1+ (B) mTECs subsets after 6 days of culture in the presence of thymocytes (without 2′-dGuo) but not in their absence (with 2′-dGuo) [(C,D), respectively]. (E–H) Proportions of CD40hiCD80+ (E) and MHCIIhiUEA1+ mTECs (F) in either EphB-deficient or WT FTOCs in the presence of thymocytes or in absence of thymocytes [(G,H), respectively]. (I,J) Dot plots showing proportions of both CD40hiCD80+ (I) and MHCIIhiUEA1+ (J) mTECs in alymphoid FTOCs after 4 days of anti-RANK treatment or its absence [(K,L), respectively]. Note the lack of differences in the proportions of CD40hiCD80+ (M) and MHCIIhiUEA1+ mTECs (N) between alymphoid mutants and WT FTOCs. (O,P) Proportions of both CD40hiCD80+ (O) and MHCIIhiUEA1+ (P) mTECs in alymphoid FTOCs after 4 days in the presence of isotype control. Indicated numerical values in dot plots show the frequency of each cell population. The significance of the Student’s t-test probability is indicated: *p ≤ 0.05; **p ≤ 0.01; ***p ≤ 0.005; and ##p ≤ 0.01 between mutants; ns, non-significant.

