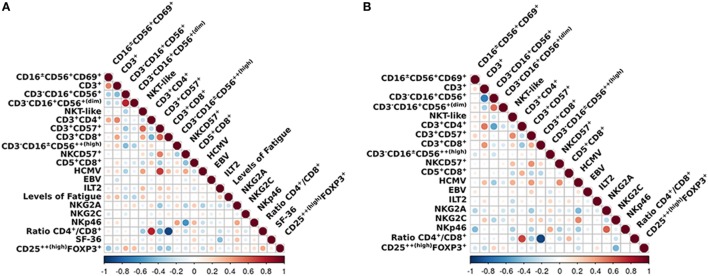
Figure 5.
Overview of the correlations of the analized immunophenotypes. Differences between (A) myalgic encephalomyelitis/chronic fatigue syndrome patients and (B) healthy controls. Color marks positive (red) or negative (blue) correlation. The size of the circle indicates the scale of the correlation.

