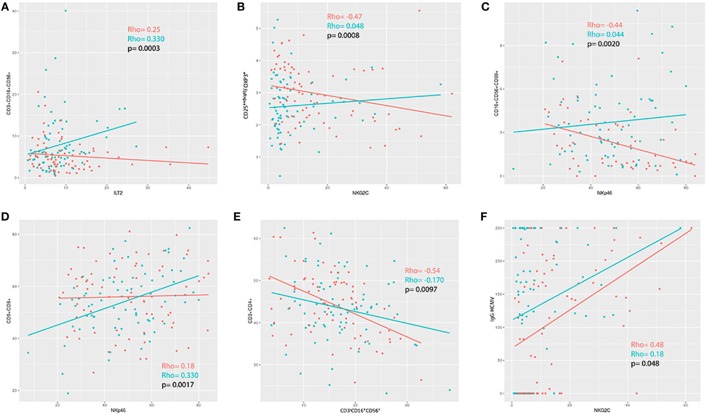
Figure 6.
(A–E) Correlation analysis between immunophenotypes in patients (blue) and healthy controls (red). (F) Positive correlation between NKG2C and IgG-HCMV for both patients and controls, although more pronounced in the patients (controls rho = 0.48; myalgic encephalomyelitis/chronic fatigue syndrome rho = 0.18; p = 0.048).

