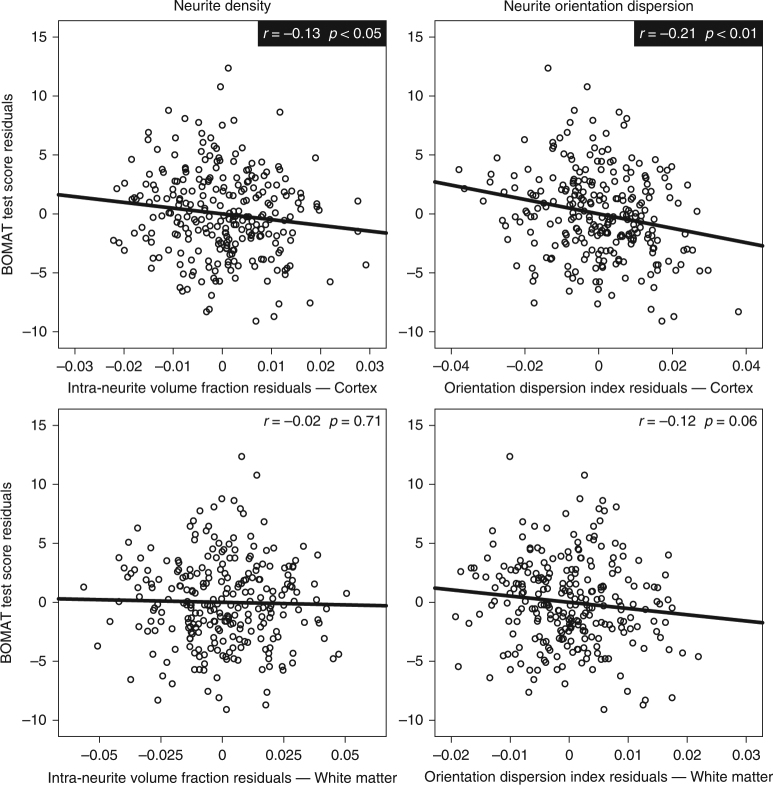
Fig. 2.
Partial correlation analyses with data from sample S259 quantifying structure–function associations at the whole-brain level. Scatter plots illustrating the relationship between neurite density and intelligence are depicted in the left column. Scatter plots illustrating the relationship between neurite orientation dispersion and intelligence are depicted in the right column. In all cases, microstructural measures were computed as mean values derived from the overall cortex (upper row) or white matter (lower row), respectively. Results are based on partial correlation analyses with age and sex being used as controlling variables. Statistically significant partial correlation coefficients (N = 259, p < 0.05) are highlighted with black boxes

