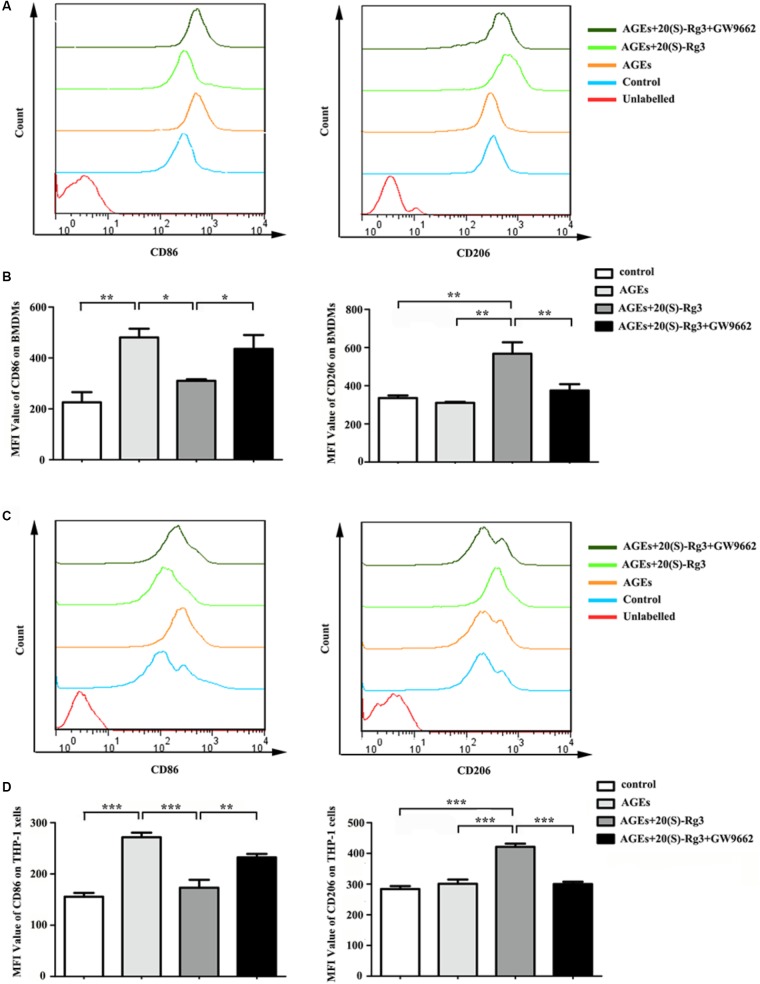
FIGURE 2.
Flow cytometry analysis of M1 and M2 surface markers (A) The expression of CD86 (M1 surface marker) and CD206 (M2 surface marker) on RAW264.7 cells were examined by flow cytometry. (B) Quantification of mean fluorescence intensity (MFI) of the surface markers (n = 3, respectively). (C) The expression of CD86 and CD206 on THP-1 cells were examined by flow cytometry. (D) Quantification of mean fluorescence intensity (MFI) of the surface markers (n = 3, respectively). The results are expressed as the mean values ± S.E.M. ∗p < 0.05, ∗∗p < 0.01, ∗∗∗p < 0.001.

