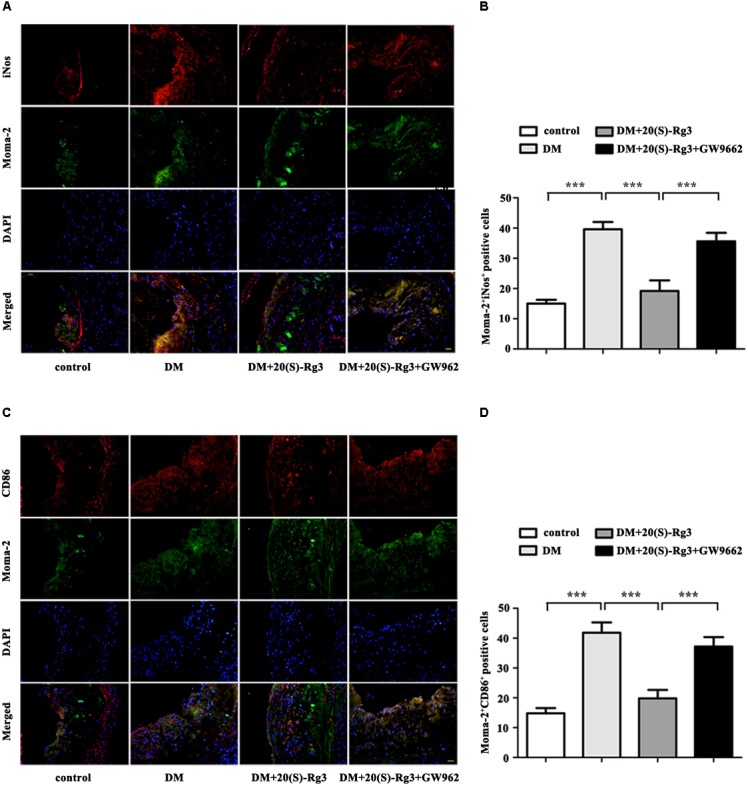
FIGURE 6.

Effects of 20(S)-Rg3 on macrophage polarization in atherosclerotic lesions of diabetic ApoE–/– mice. (A,B) Co-immunofluorescence staining of the aortic root for macrophage (anti-Moma-2 antibody, green) and M1 marker iNos (red), and a bar graph summarizing the results (n = 5, respectively). (C,D) Co-immunofluorescence staining for macrophage (anti-Moma-2 antibody, green) and M1 marker CD86 (red), and a bar graph summarizing the results (n = 5, respectively). Scale bar: 20 μm. Data are mean ± SEM. ∗p < 0.05, ∗∗p < 0.01, ∗∗∗p < 0.001.
