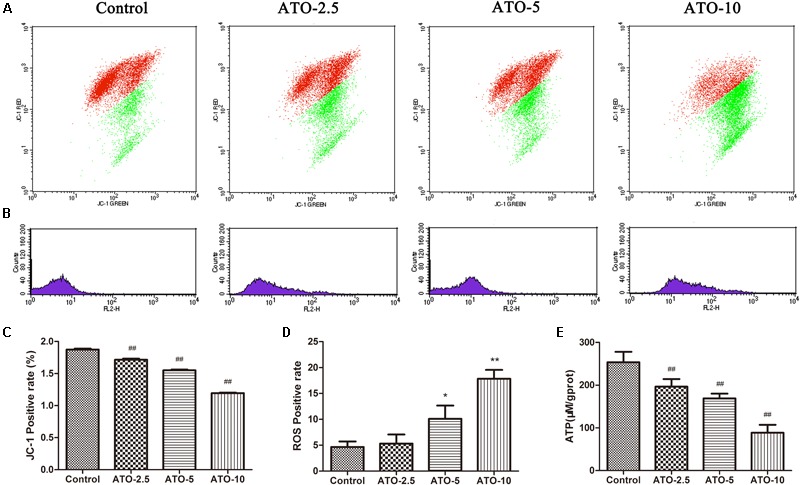
FIGURE 2.

The effects of ATO treatment on mitochondrial injury in H9c2 cells. (A) A flow cytometric analysis of the mitochondrial membrane potential by JC-1 staining of H9c2 cells. (B) The effects of ATO on the mitochondrial ROS levels. (C,D) A statistical analysis of the flow cytometry data. (E) The effects of ATO on the ATP levels. The data are expressed as the means ± SD from three independent experiments. ∗p < 0.05 versus control; ∗∗p < 0.01 versus control.
