FIGURE 5.

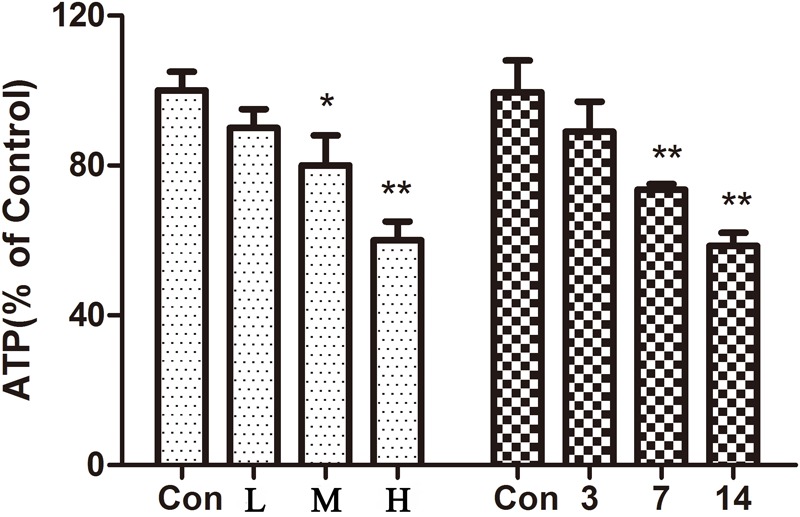
Effect of ATO on ATP in mice. The data are expressed as the means ± SD from three independent experiments. ∗p < 0.05 versus control; ∗∗p < 0.01 versus control.

Effect of ATO on ATP in mice. The data are expressed as the means ± SD from three independent experiments. ∗p < 0.05 versus control; ∗∗p < 0.01 versus control.