
FIGURE 8.
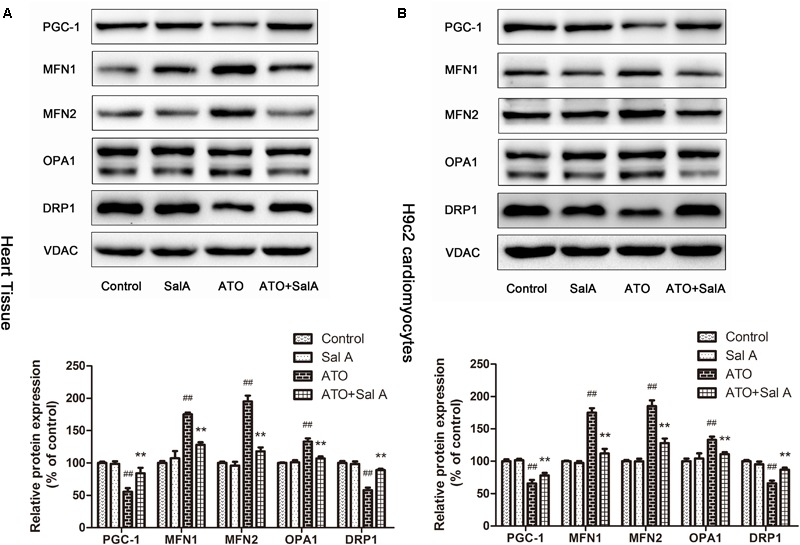
The effect of Sal A on mitochondrial biogenesis-related protein expression after ATO treatment. (A) Protein expression in the heart tissue. (B) Protein expression in H9c2 cells. All data are expressed as the mean ± SD of three independent experiments; ##p < 0.01 versus control, ∗∗p < 0.01 versus ATO.