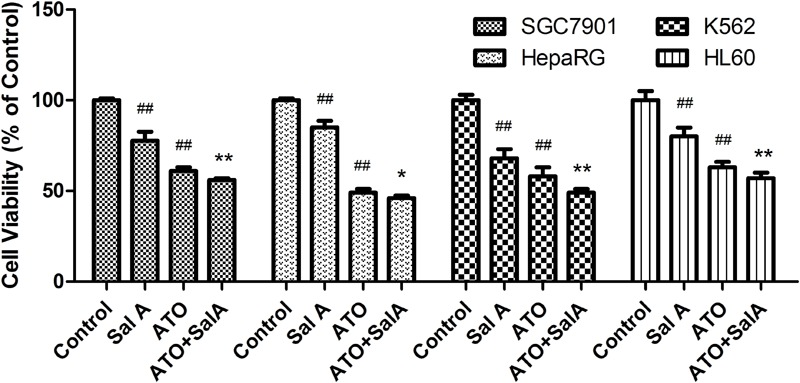
FIGURE 9.

Effects of Sal A and ATO treatment on the cell viability of cancer cells. SGC7901, HepaRG, K562 and HL60 cells were treated with ATO (5 μM) in the presence or absence of Sal A (25 μM) for 24 h. Cell viability was determined by the CCK8 assay and expressed as a percentage of the control for each cell line. The data are expressed as the means ± SD of three independent experiments. ##p < 0.01 versus control; ##p < 0.01 versus control; ∗p < 0.05 versus ATO-treated cells; ∗∗p < 0.01 versus ATO-treated cells.
