
Fig. 4.
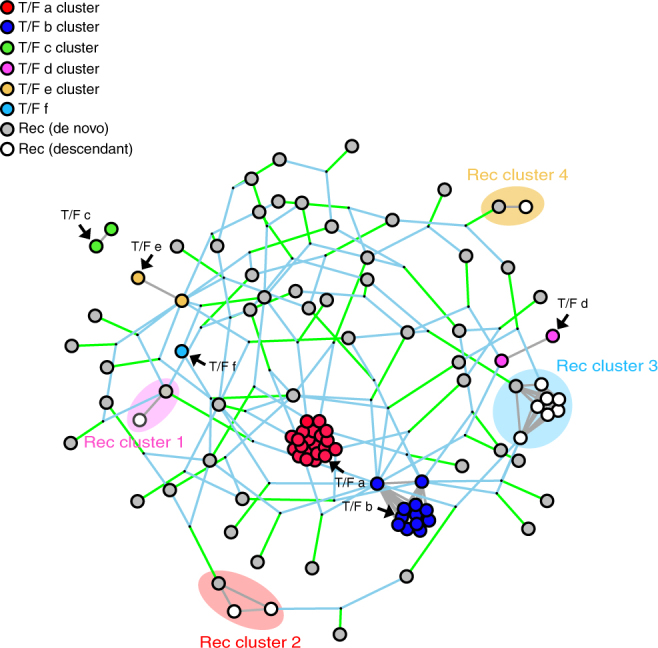
Clustering graph of the 3′ half genome sequences from CH0010. Each circle represents a sequence, and circles of the same color represent a T/F lineage. Gray circles represent de novo recombinant sequences and open circles represent descendants of recombinant sequences. Clusters are calculated using a greedy algorithm and they originate either from a T/F lineage or through recombination across lineages. Recombination clusters are shaded and color coded to indicate their closest T/F lineage. At most one sequence per recombination cluster is called a de novo recombinant: the rest are assumed to be descendants of this recombinant sequences. Light blue lines point to recombinant parents and green lines to the recombinant child