Fig. 2.
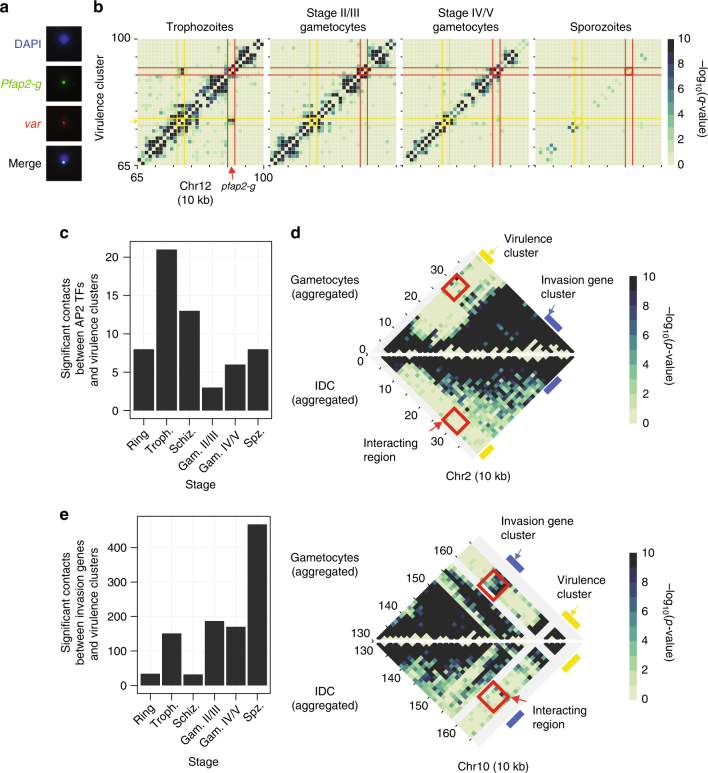
Changes in interaction of pfap2 genes and invasion genes with the repressive center. a Colocalization of pfap2-g and var gene PF3D7_0800300 by DNA-FISH. Additional images are presented in Supplementary Fig. 8. b Dissociation of the gametocyte-specific transcription factor locus pfap2-g (red) from the nearby internal virulence gene cluster (yellow) in stage II/III gametocytes. c Overall reduced number of intrachromosomal and interchromosomal interactions between pfap2 TF genes and virulence genes in gametocytes and sporozoites as compared to the IDC stages. d Invasion gene clusters (blue bar) on chromosomes 2 (top) and 10 (bottom) interact with subtelomeric virulence genes (yellow bar) in gametocytes, but not during the IDC. In each plot, the top triangle shows the aggregated data of both gametocyte stages, while the bottom triangle shows the aggregated data from the three IDC stages. Bins that depict interactions between virulence genes and invasion genes are highlighted by a red box. e Increased number of intrachromosomal and interchromosomal interactions between invasion genes and virulence genes in gametocytes and sporozoites as compared to the IDC stages

