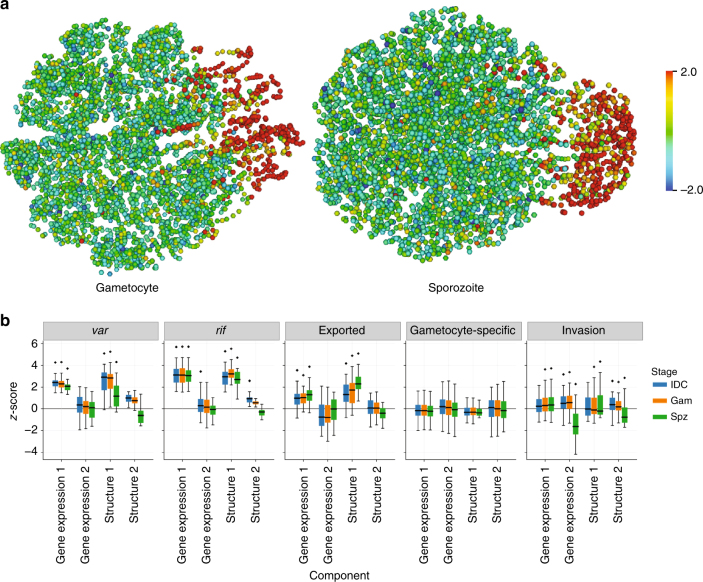
Fig. 6.
3D genome structure correlates with gene expression. a Each gene is plotted by its position within the 3D structure and is colored by its standardized KCCA score (see Supplementary Information) in the first gene expression component. The direction of this first gene expression component is from the telomere cluster on the right to the opposite side of the nucleus and is dominated by the repressive center (genes colored in red). b The distribution of standardized KCCA scores for the first and second gene expression components and the first and second structure components of specific groups of genes. The box plots show the median, first and third quartile, and the minimum and maximum values. Diamonds indicate groups of genes for which the standardized KCCA scores for both the gene expression component and the structure component were significantly different (t-test, FDR < 0.1%)

