Fig. 1.
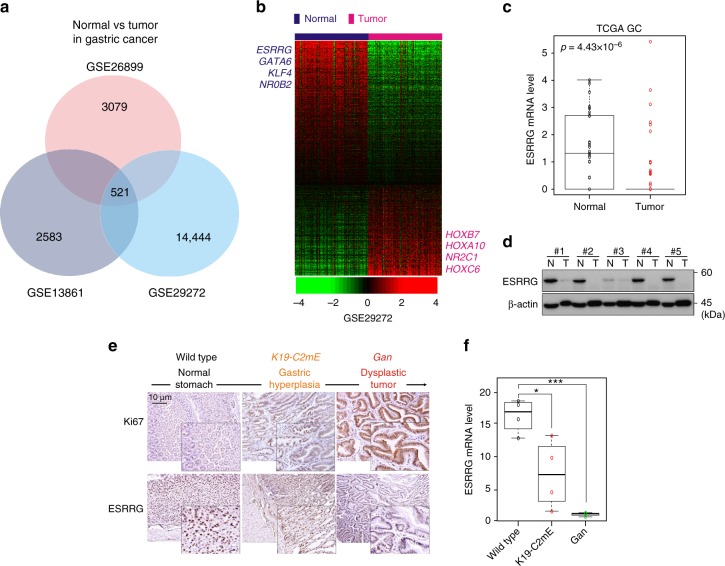
ESRRG expression in GC patients and in a mouse model. a Venn diagram of genes showing significant differential expression between normal and cancer tissue in the three different GC patient cohorts. A univariate test (two-sample t-test) with a multivariate permutation test (10,000 random permutations) was employed. In each comparison, a cut-off p-value of less than 0.001 was applied to retain genes with an expression level that differed significantly between the two groups of tissues examined. b Expression patterns of selected genes shared in the three GC patient cohorts. The expression of 521 genes was commonly up- or downregulated in all three cohorts. Colored bars at the top of the heat map represent samples as indicated. Genes involved in transcription are highlighted in blue or red text. c ESRRG expression from TCGA data. d Western blot analysis from normal gastric and tumor tissues. e, f Gastritis in K19-C2mE mice and gastric tumors in K19-Wnt1/C2mE mice. e Immunohistochemistry (IHC) staining of Ki67 and ESRRG in wild type (left), K19-C2mE (middle), and Gan (right) mouse stomachs. f ESRRG mRNA levels in the GC mouse model. Original magnification, ×200. Data represent the mean ± s.d. (error bars) from the indicated samples (n = 4 per group). Student’s t-test was used to examine statistical significance (* p < 0.05, *** p < 0.005)

