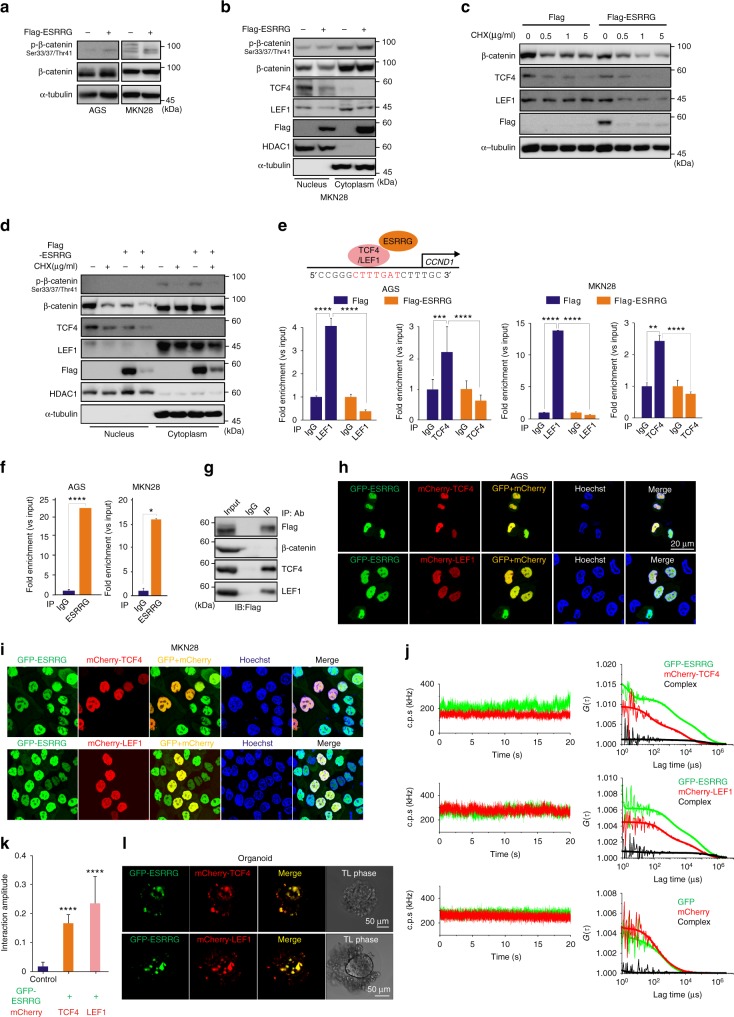
Fig. 5.
ESRRG directly antagonizes Wnt signaling. a, b AGS or MKN28 (b) cells were infected with Flag or Flag-ESRRG-lentiviral vector. The cells (a) including fractionated samples (b) were also used for western blotting with the indicated antibodies. c, d The infected AGS (c) and MKN28 (d) cells were treated with CHX for the indicated times and the samples were used for western blotting with the indicated antibodies. e ChIP assays were performed on AGS or MKN28 cells after transfection with ESRRG using a TCF4/LEF1 antibody. Recruitment of ESRRG to the CCDN1 promoter via TCF4/LEF1 was analyzed using primers specific to the CCND1 promoter. f ChIP assay was done with ESRRG antibody. IgG was used as an internal control. g Immunoprecipitation was done in MKN28 cells with the indicated antibodies and detected with Flag antibody. h, i, l GC cells or organoids (l) were transfected with GFP-ESRRG and mCherry-TCF4 or LEF1 and used for cellular imaging under a confocal microscope. j Changes over time in the average fluorescence intensities (count per second; c.p.s in kHz) of GFP-ESRRG (green) and mCherry-TCF4 or LEF1 (red), and the corresponding correlation functions, are shown. Changes over time in the average fluorescence intensity and the corresponding correlation functions obtained in cells co-expressing monomer GFP and mCherry are also shown. k Summary of protein interaction amplitudes. The interaction amplitude represents the mean value of the relative cross-correlation amplitude. Data represent the mean ± s.d. from three independent replicates. Student’s t-test was used to examine statistical significance (*p < 0.05, **p < 0.01, ***p < 0.005, ****p < 0.001)

