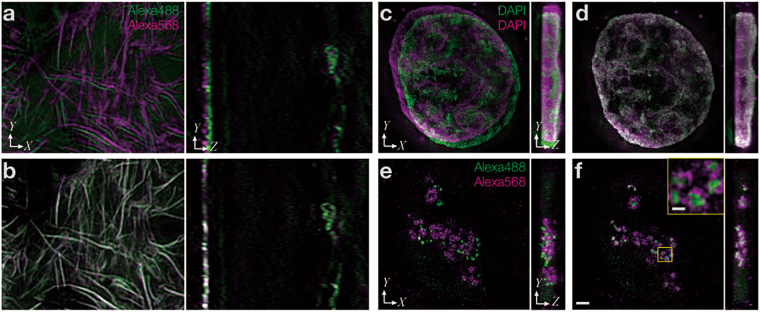
Figure 1.
Registration methods to measure and correct chromatic shift using biological samples. Representative 3D-SIM images. (a) Actin filaments stained with dye-conjugated phalloidin. The same image is shown in the green (shown in green) and orange (shown in purple) emission ranges, detected simultaneously with different cameras. (b) The same image as in (a) after chromatic correction. (c) Nuclear DNA stained with DAPI excited at 405 nm. Images of normally discarded bleed-through signals in the green and orange emission ranges, detected simultaneously with different cameras. (d) The same image as in (c) after chromatic correction. (e) Nucleolar proteins, treacle and fibrillarin, stained with Alexa Fluor 488 and 568 in the same cell and shown at the same focus position as in (c). Images were acquired by sequential excitation with 488 and 561 nm, for detection in the green and orange emission channels, respectively. (f) The same image as in (e) after registration using the same parameters used to align (c). The boxed region was magnified and is shown in the inset. The scale bar is 2 µm for panels (a–f) and 0.5 µm for the inset in (f).

