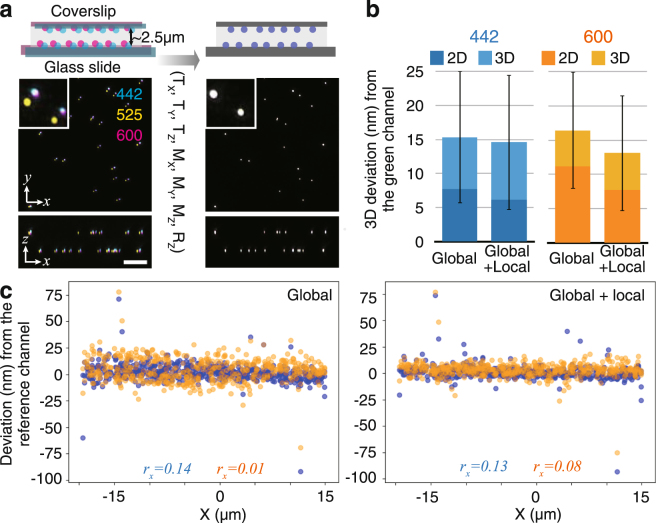
Figure 4.
Registration precision. (a) A 3D-SIM image of multicolor beads immobilized both on the coverslip and on the glass slide before (left) and after (right) registration. Maximum projections of the quarter field of view (20 × 20 × 8 µm) along the XY plane and the XZ plane are shown with a region magnified in the inset. The blue, green, and orange channels are indicated by their respective central emission wavelengths. Scale bars represent 5 µm for the larger field of view including the vertical (Z) axis and 1.25 µm for the inset. (b) Mean distances of individual bead localizations in the blue and orange channels relative to the green reference channel, applying the ‘global’ and ‘global + local’ registration methods. The 3D positions of 527 beads on two-layer multicolor bead samples were determined by 3D Gaussian fitting, and the 3D distances were averaged. Error bars indicate SD. (c) Plots of beads along the X coordinate. The Pearson correlation coefficient (r) is shown for each channel to show the correlation, if any, between deviation and position in the field of view.

