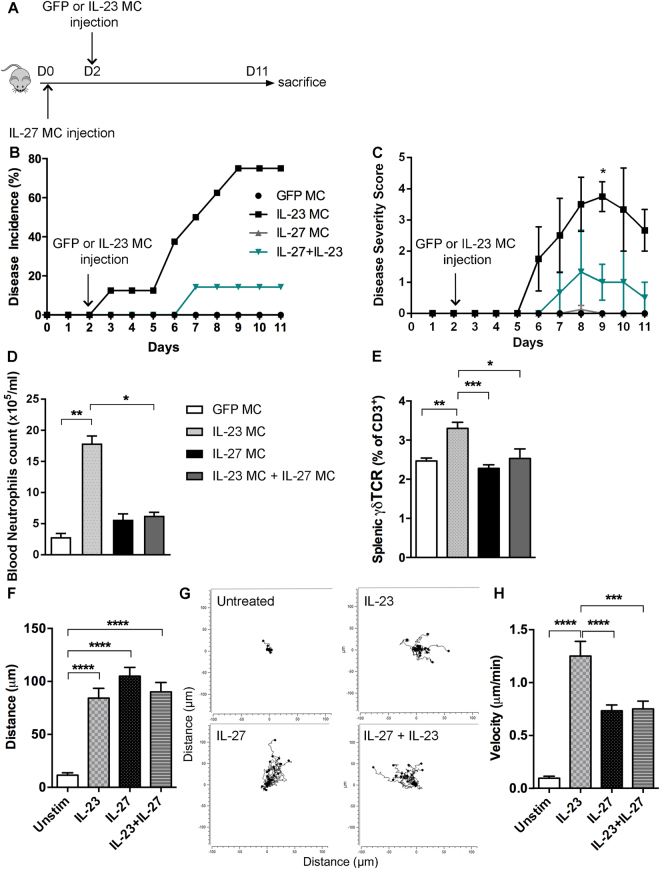
Figure 4.
IL-27 inhibitory effect on the development of IL-23-induced arthritis. (A) Schematic illustration of the experimental protocols. B10.RIII mice at the age of 10–12 weeks were injected on days 0 with IL-27 MC prior GFP or IL-23 MC injection at day 2. (B) Time course of disease incidence and (C) severity score of arthritis in B10.RIII mice after GFP MC, IL-23 MC, IL-27 MC, or IL-23 + IL-27 MC injection (n = 7–10 per group). Data are representative of three independent experiments. All data are shown as mean ± SEM. *p < 0.05, as determined by using two-tailed Student’s t-test. (D) Quantification of CD11b+ Ly-6G+ blood neutrophils in mice injected with GFP MC, IL-23 MC, IL-27 MC or IL-23 + IL-27 MC. (E) Percentage of splenic γδ T cells analyzed by flow cytometry of the isolated splenocytes of each group. (F) Analysis of neutrophil migratory distance (in μm) under IL-23, IL-27 or IL-23 + IL-27 stimulation. (G) Representative neutrophil trajectory plots over a 2-hour period. (H) Analysis of neutrophils velocity (μm/min) under IL-23, IL-27 or IL-23 + IL-27 stimulation. Data are representative of two independent experiments. All data are shown as mean ± SEM. *p < 0.05, ** p < 0.01, ***p < 0.001, ****p < 0.0001. Statistical analysis was performed using one-way ANOVA with Sidak’s multiple comparisons test.

