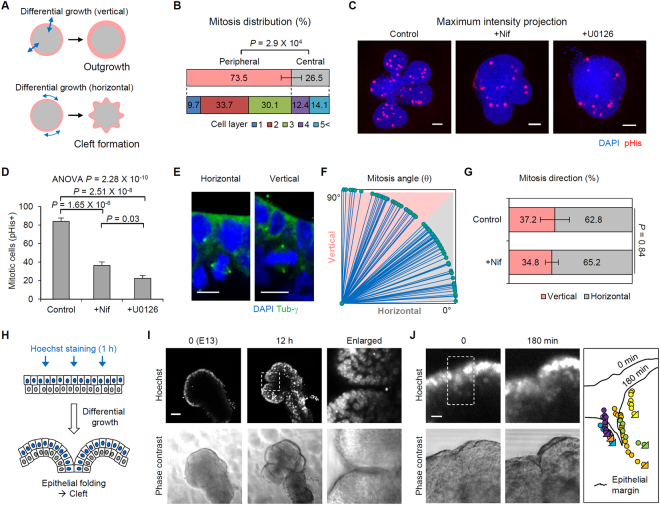
Figure 4.
Differential growth promotes cleft initiation. (A) The determination of morphological patterns of epithelial buds by the orientation of differential growth. (B) Spatial distribution of mitotic cells in eSMGs. n = 7 buds. (C) Maximum intensity projection images (Z-axis) of mitotic cells in eSMGs treated with 100 μM nifedipine or 10 μM U0126. pHis: phospho Histone H3. (D) Mitotic cell numbers (pHis positive cells) in developing eSMGs. n = 7 (E) Representative images of the cells under horizontal (left) and vertical (right) mitosis. (F) Distribution of mitosis angle in developing eSMGs. n = 82 cells (G) Distribution of mitosis direction in developing eSMGs. n = 12 (control) and 15 (+100 μM Nifedipine) buds. (H) Experimental scheme for live imaging of developing epithelial bud with selective staining of the peripheral nucleus (see Methods section). (I) Epithelial dynamics (Hoechst-stained; upper panels) and phase contrast images (lower panels) of a developing eSMG. Dotted region indicates the epithelial folding site. (J) Tracking images of the movement of the peripheral nucleus. Right: tracking results of a single cell in the dotted region. Tirangular points in the tracking results indicate the end position of the nucleus. Data are represented as mean ± SEM. Scale bars: 10 (E and J), 50 μm (C and I).

