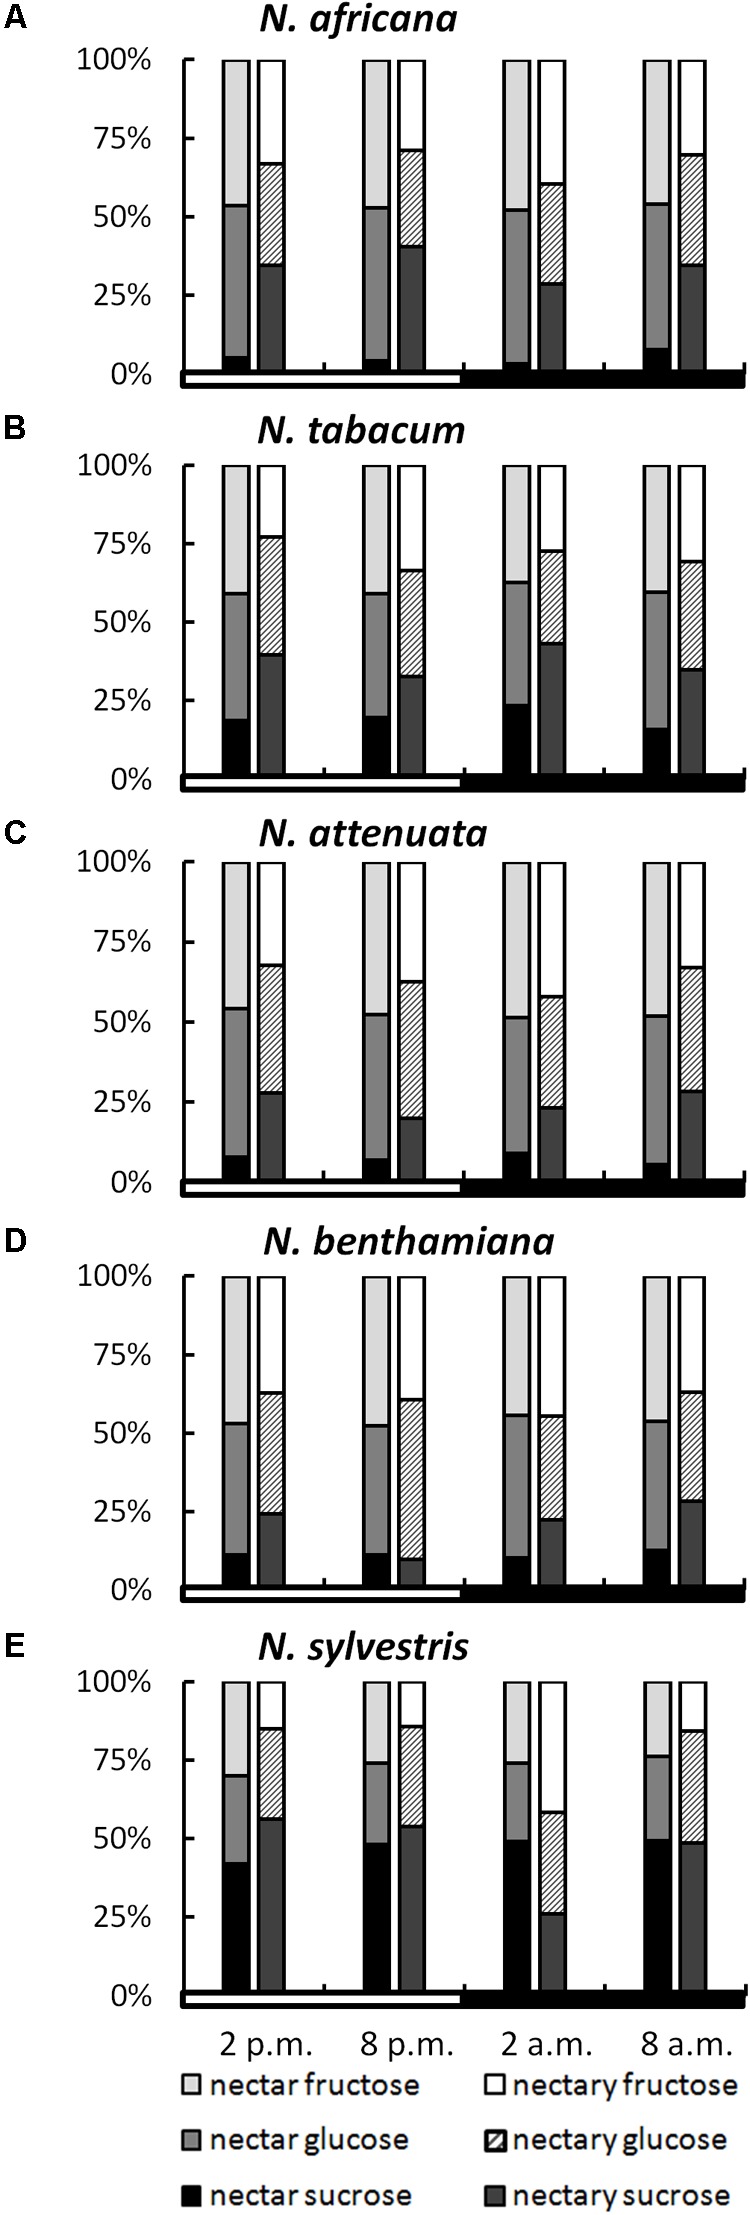
FIGURE 3.

Sugar percentages in nectaries and nectar. All percentages were calculated from mM; n = 3; light and dark periods are indicated by white and black bars; one pair of bars indicates one time point of sampling, with the Left bar representing nectar and the Right bar representing nectaries. (A) N. africana, (B) N. tabacum, (C) N. attenuata, (D) N. benthamiana, and (E) N. sylvestris.
