FIGURE 4.

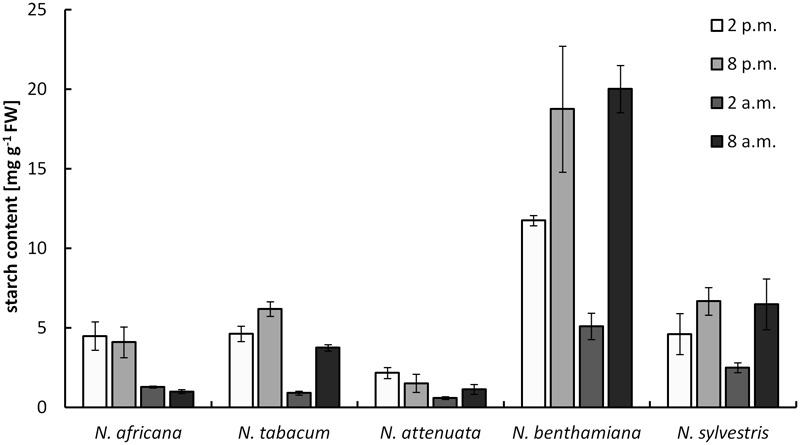
Starch concentration in nectaries. Mean values from all measurements taken at one time point (n = 3) and the respective SDs were plotted.

Starch concentration in nectaries. Mean values from all measurements taken at one time point (n = 3) and the respective SDs were plotted.