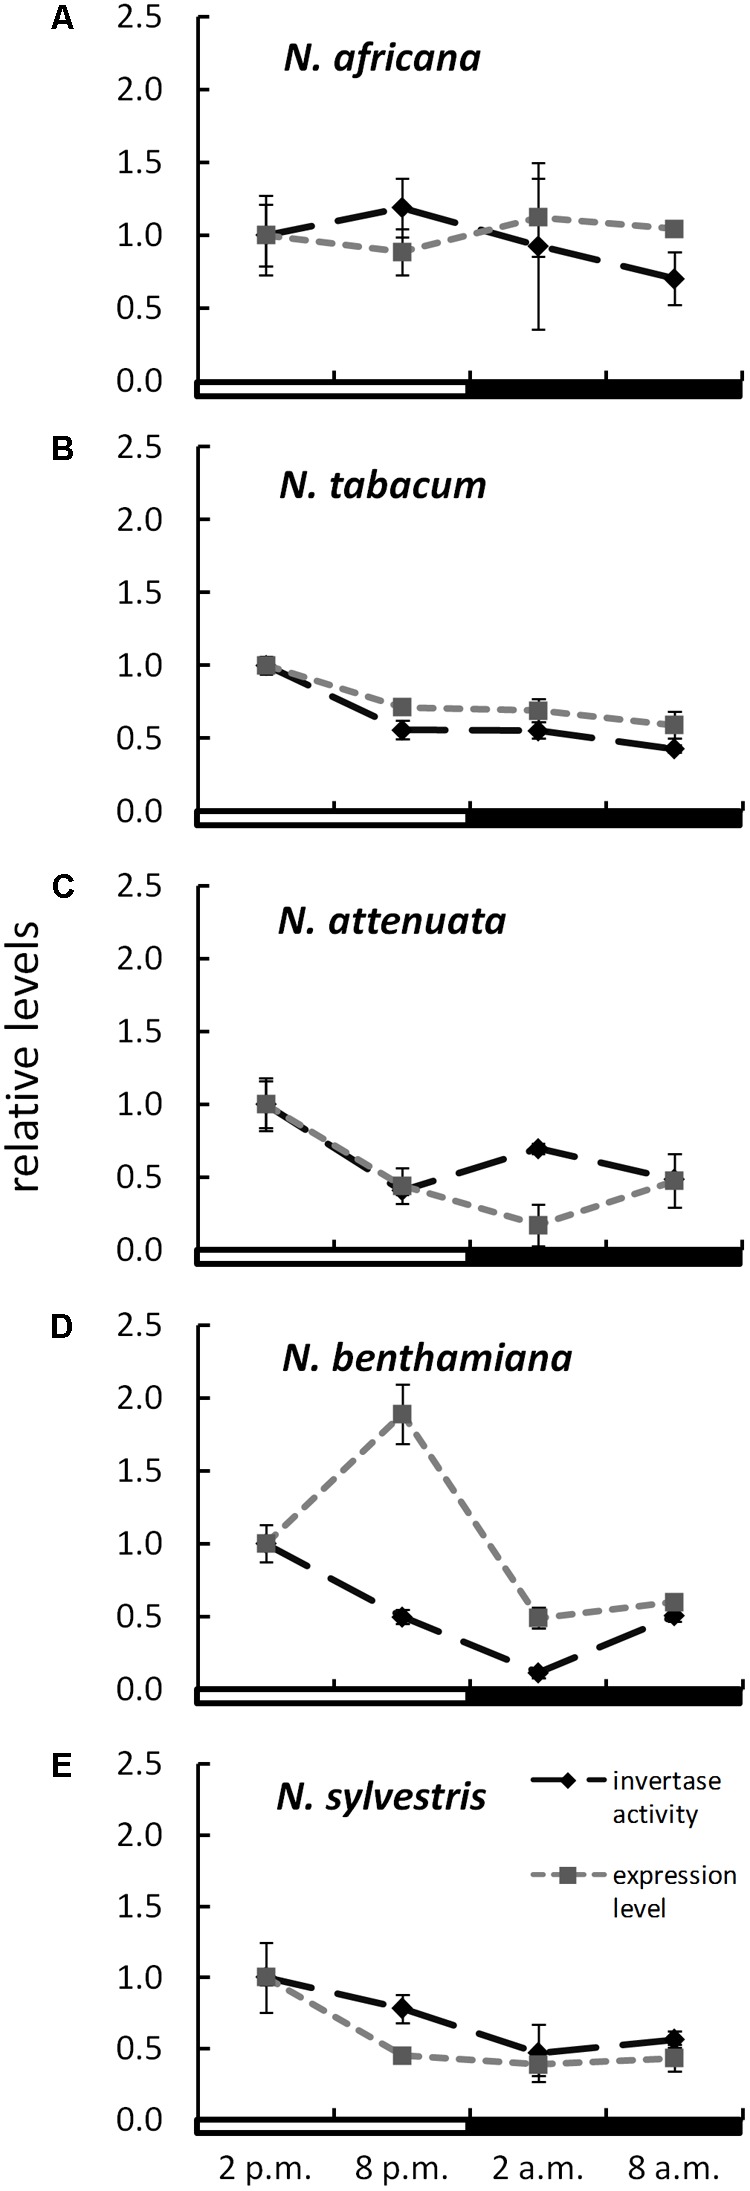
FIGURE 6.

Invertase activity in comparison to expression level in the nectaries of different Nicotiana species Activity and expression levels are given relative to the calibrator (2 p.m.). Mean values from all measurements taken at one time point (n = 6 for enzyme activity and n = 3 for expression levels) and the respective SD were plotted; light and dark periods are indicated by white and black bars. (A) N. africana, (B) N. tabacum, (C) N. attenuata, (D) N. benthamiana, and (E) N. sylvestris.
