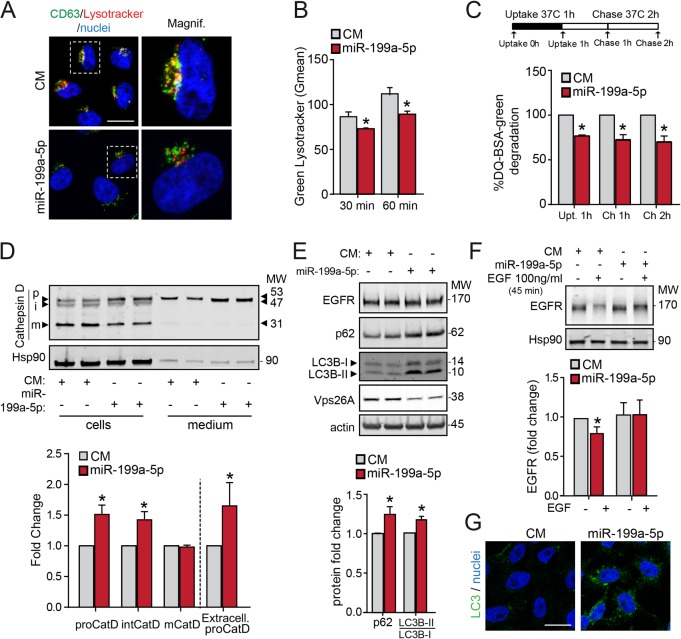
FIG 9.
miR-199a-5p regulates endolysosomal trafficking. (A) Confocal microscopy immunofluorescence images showing subcellular localization of CD63 subjected to LysoTracker internalization for 30 min at 37°C in HeLa cells transfected with CM or miR-199a-5p. Magnif, magnification of areas in dashed boxes. Scale bar = 15 μm. (B) Flow cytometry analysis of LysoTracker internalization at 37°C in HeLa cells treated as described in the legend to panel A. Data are expressed as the geometric mean values (Gmean) from three independent experiments. Data are expressed as geometric mean values (Gmean) ± SEM from three independent experiments. (C) Results of flow cytometry analysis of CM- or miR-199a-5p-transfected HeLa cells that were cultured in the presence of 200 μg/ml fluorescent DQ green BSA for 1 h at 37°C and then incubated at 37°C for 2 h. Data are expressed as fold change of Gmean ± SEM. (D) HeLa cells were transfected with CM and miR-199a-5p, and 24 h after transfection, cells were rinsed with PBS and incubated in serum-free culture medium for 24 h. The medium was collected and precipitated with trichloroacetic acid (TCA), and the resulting pellets were analyzed by 4-to-20% acrylamide gradient SDS-PAGE and immunoblotted with rabbit polyclonal antibody against cathepsin D (CatD). Blots were also probed with antibody to Hsp90 as a loading control. The positions of molecular weight markers (MW; in thousands) and of the precursor (p), intermediate (i), and mature (m) forms of cathepsin D are indicated. Bottom, quantification of the results of 3 independent experiments. (E) Western blot analysis of EGFR, p62, LC3B-I/LC3B-II, and Vps26A protein levels in CM- and miR-199a-5p-transfected cells. Bottom, quantification of the results. (F) EGFR degradation assay in HeLa cells transfected with CM or miR-199a-5p and stimulated with EGF for the indicated times. Right, quantification of the results. (D to F) Error bars indicate SEM. *, P ≤ 0.05. (G) Immunofluorescence analysis of LC3B in HeLa cells transfected with CM or miR-199a-5p. Scale bar = 15 μm.

