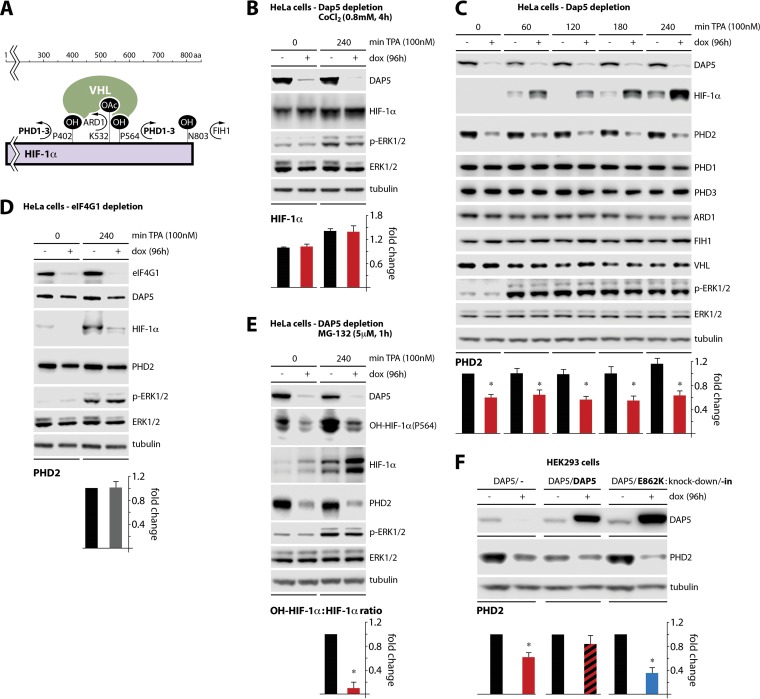
FIG 5.
DAP5 depletion induces HIF-1α by depressing PHD2 levels. (A) Schematic overview of posttranslational modifications and interactions of HIF-1α. (B) HeLa cells with dox-inducible DAP5 depletion were dox treated (96 h) and pretreated with CoCl2 (4 h) before TPA stimulation. The cells were harvested for immunoblotting. The mean HIF-1α/tubulin ratio was quantified, normalizing between experiments by setting the no-dox, no-TPA control to 1. (C) HeLa cells with dox-inducible DAP5 depletion were dox treated (96 h) and lysed for immunoblotting with the antibodies shown. The mean PHD2/tubulin ratios were quantified, normalizing between experiments by setting the no-dox, no-TPA time point to 1. (D) HeLa cells with dox-inducible eIF4GI depletion were dox treated as shown and mock or TPA stimulated (240 min). The mean PHD2/tubulin ratio was quantified, normalizing by setting the 240-min TPA, no-dox ratio to 1 for each experiment. (E) The assay described for panel D was repeated with the addition of MG-132 pretreatment (5 μM; 1 h) prior to TPA stimulation. The mean OH-HIF-1α (P564)/HIF-1α ratio was quantified, normalizing by setting the no-dox value to 1. (F) HEK293 cells with dox-inducible knockdown/knock-in as described for Fig. 4C were dox treated as shown and analyzed by immunoblotting. The mean PHD2/tubulin ratios were quantified, normalizing by setting the no-dox values to 1. All data bars represent the means of three independent experiments; error bars display the SEM. *, significant P value (P < 0.05).

