FIG 5.
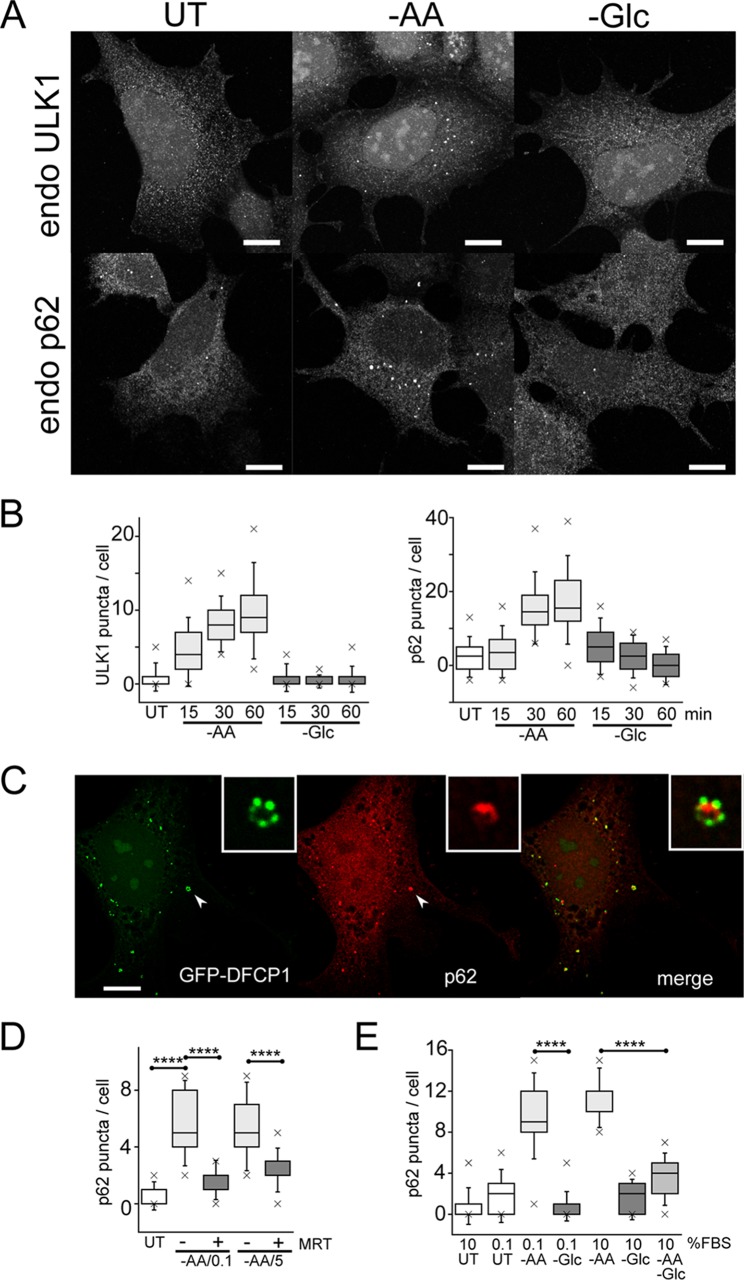
Glucose starvation inhibits autophagosome formation. (A) HEK293A cells were incubated under amino acid or glucose starvation for 2 h. Starvation conditions included 0.1% dialyzed FBS. Cells were stained for endogenous ULK1- or p62-labeled autophagosomes. Scale bars, 10 μm. (B) HEK293A cells were starved as for panel A for the times indicated, and ULK1 and p62 puncta/cell were quantified. Each box represents 38 cells, representative of the results of 2 experiments. (C) Wild-type MEF expressing GFP-DFCP1 were starved of amino acids as for panel A for 2 h. The cells were stained for endogenous p62 puncta. The arrowheads point to the autophagosome shown enlarged in the insets. Scale bar, 10 μm. (D) HEK293A cells were starved of amino acids for 2 h. Starvation conditions included 0.1 or 5% dialyzed FBS or addition of MRT68921 (10 μM), as indicated. Each box represents 40 cells, representative of the results of 2 experiments. (E) HEK293A cells were starved of amino acids, glucose, or both together for 2 h. Dialyzed serum concentrations were also varied during starvation, as indicated. Each box represents 40 to 50 cells, representative of the results of 2 experiments. In box-and-whisker plots, the boxes show the 25th and 75th percentiles and means, and the whiskers show standard deviations. ×, 1st and 99th percentiles; ****, P < 0.0001; ANOVA with Tukey's posttest.

