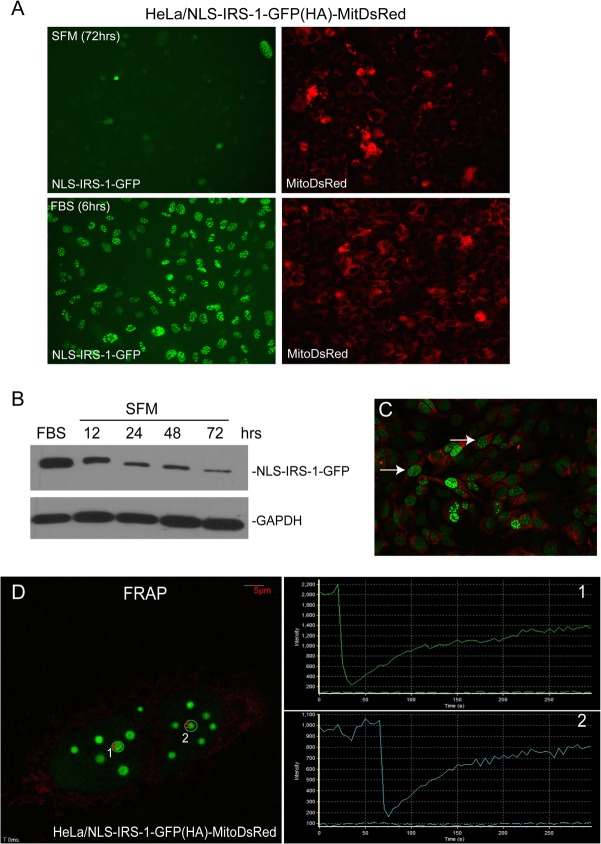
FIG 5.
Dynamics of IRS-1/LC3 nuclear structures determined in HeLa clones stably expressing NLS–IRS-1–GFP/MitoRed. (A) Cells were starved in serum-free medium (SFM) for 72 h and subsequently stimulated with 10% FBS for 6 h. Both EGFP fluorescence and MitoRed fluorescence were registered. The time-lapse images were acquired every 30 min for 6 h by using a VivaView LCV110U instrument (Olympus). The presented images show the starting point (SFM at 72 h) and the 6-h time point following FBS stimulation (FBS at 6 h) of the 24-h time-lapse experiment (see Movie S3 in the supplemental material). (B) Western blot analysis indicating IRS-1 protein levels following stimulation with 10% FBS for 6 h and following serum starvation in SFM for 12, 24, 48, and 72 h. (C) Time-lapse images were taken every 10 min for 12 h following serum stimulation (10% FBS). Two cells indicated by arrows are positive for IRS-1 ringlike structures and are undergoing mitotic division, as shown by the time-lapse experiment depicted in Movie S2. (D) Fluorescence recovery after photobleaching (FRAP). Shown are representative fluorescent images of two areas selected for photobleaching (two white circles labeled 1 and 2). The two plots on the right side of the image show increasing intensities of fluorescence after photobleaching obtained from areas 1 and 2, respectively. Time-lapse analysis of FRAP is provided in Movie S3.

